Logística Inteligente
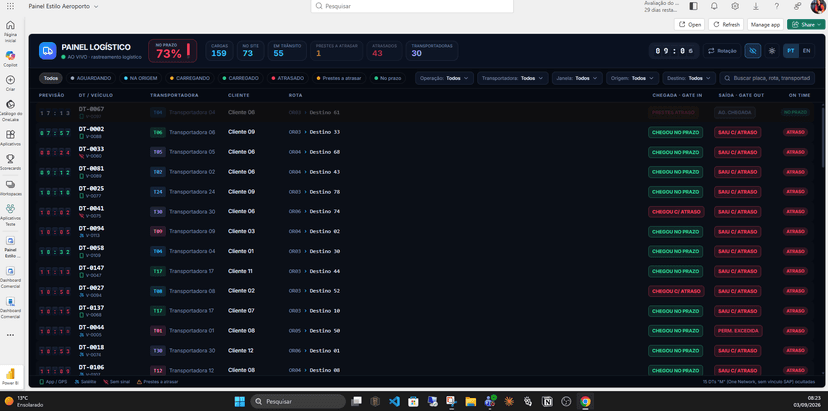
Your shipment is going to be late. The question is: how early will your operation be able to detect it?
In many transportation operations, a delay only becomes visible after it has already happened.

The real-time loading visibility challenge
In logistics, Stop time turns cost. Loading delays, queues in the courtyard and lack of operational visibility directly impact the financial result, service level and customer experience.
This is exactly where the Visual management with Power BI becomes a strategic ally.
In many operations, load control still depends on spreadsheets, WhatsApp messages, radio or decentralised information. The result is predictable:
Without reliable and up-to-date data, the manager loses control of flow and operational efficiency.
The solution presented in this project was the development of a Power BI Load Management panel, using the concept of Visual Kanban.
Each truck is represented as a card, which visually tracks the steps of the process:
This view allows the entire operation to be monitored in real timeOn a single screen, no communication noises.
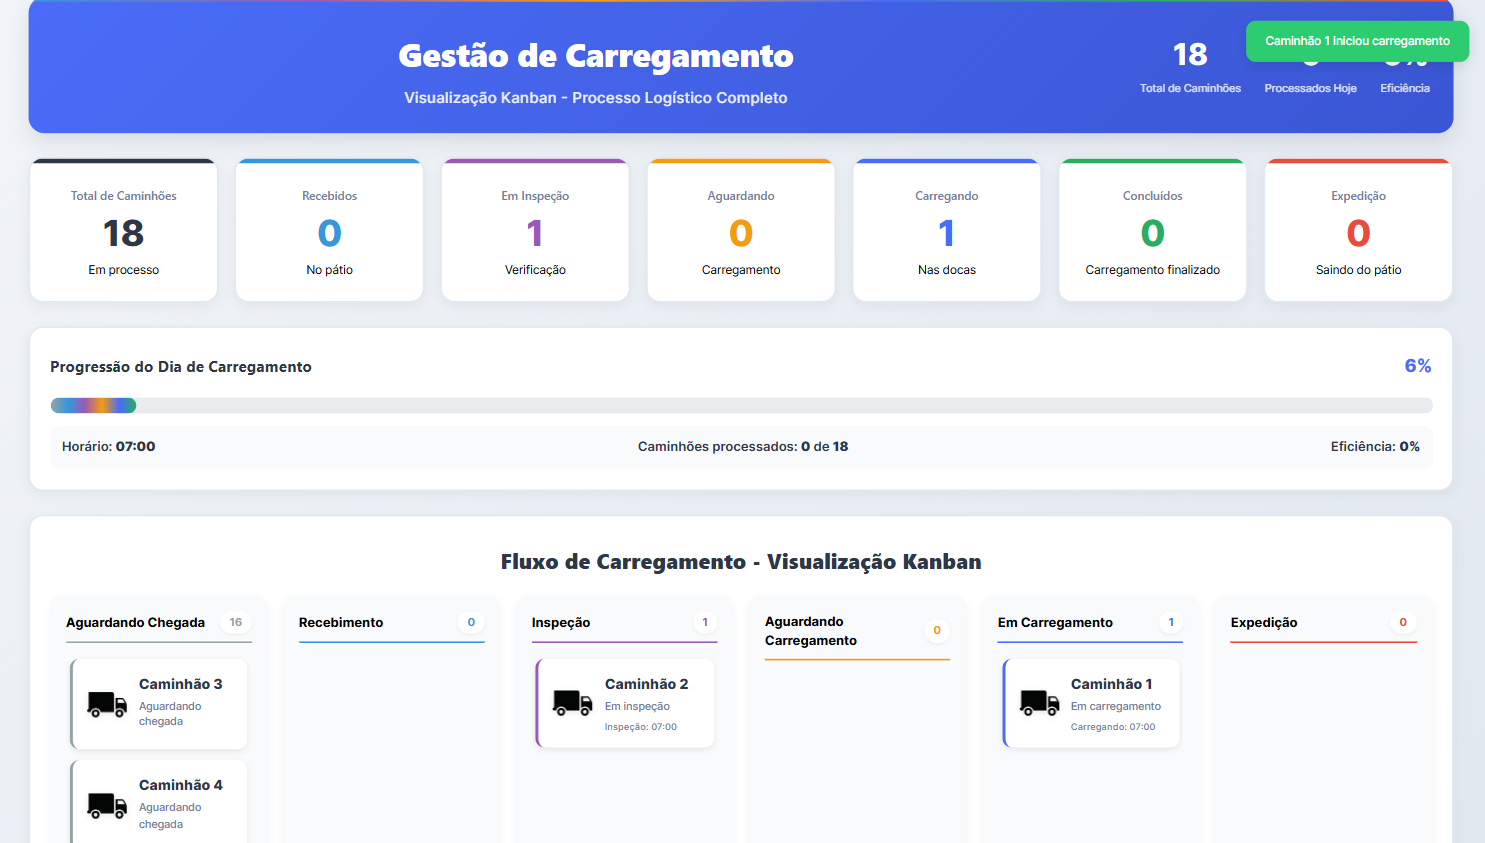
With visual management applied to loading, the operation will quickly answer critical questions such as:
In addition, the panel enables historical analysis, comparison of shifts, teams and days of the week, supporting strategic decisions and continuous improvements.
Power BI acts as the brain of this operation, consolidating data from different sources (ERP, TMS, internal controls) and transforming everything into actionable information.
Among the main gains are:
Companies that see their processes in real time can act preventively, not correctively. Visual management applied to logistics is no longer just a beautiful panel and becomes a strategic management tool.
Na DriveData, we develop solutions to Custom Business Intelligence, connecting your operational data to business strategy.
We create smart dashboards, automations and analytics that help your company:
You want to transform your logistics operation with data?
Talk to DriveData and see how visual management with Power BI can raise the level of your logistics.
In many transportation operations, a delay only becomes visible after it has already happened.
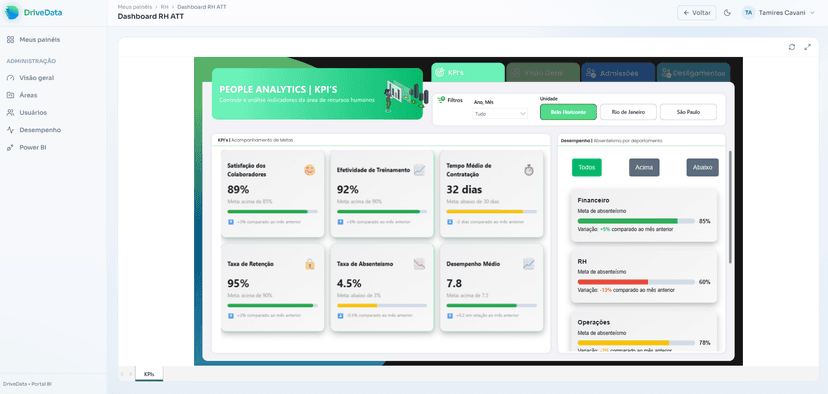
From per-user licensing to shared capacity: the (real case with fictional data) case of a retailer that stopped having to choose between "saving money" and "giving everyone access."
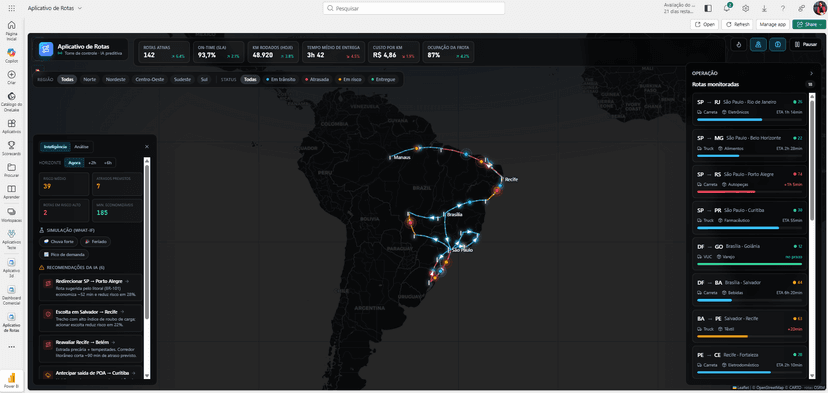
What changes for Power BI and Microsoft Fabric professionals now that the platform is starting to host action — not just analysis.
Tamires · DriveData
online now