By Tamires Cavani, September 3, 2026
The vehicle did not arrive at the scheduled time, the customer got in touch, the team began searching for information across different systems, and the carrier was contacted to explain an incident that had already affected the operation.
This management model is reactive: first the problem occurs, and only then does the investigation begin.
A modern Control Tower must reverse this logic. Its purpose is not only to show which shipments are already late, but to identify which ones are likely to be late—while there is still time to act.
With this concept in mind, we developed a logistics monitoring experience inspired by airport flight information boards: a direct, dynamic, exception-driven operational view. Just as passengers can quickly determine whether a flight is scheduled, boarding, or delayed, the operation can monitor each shipment according to its current status and projected on-time performance.
From a dashboard that explains the past to an application that changes the outcome
Traditional dashboards are excellent for historical analysis. They show how many deliveries were late, which carriers performed poorly, and which routes accounted for the highest number of incidents.
This information is important, but it arrives too late to prevent the problem.
A Control Tower powered by Microsoft Fabric and Fabric Apps takes a different approach: it transforms data into an operational application capable of monitoring events, applying business rules, identifying risks, and directing action.
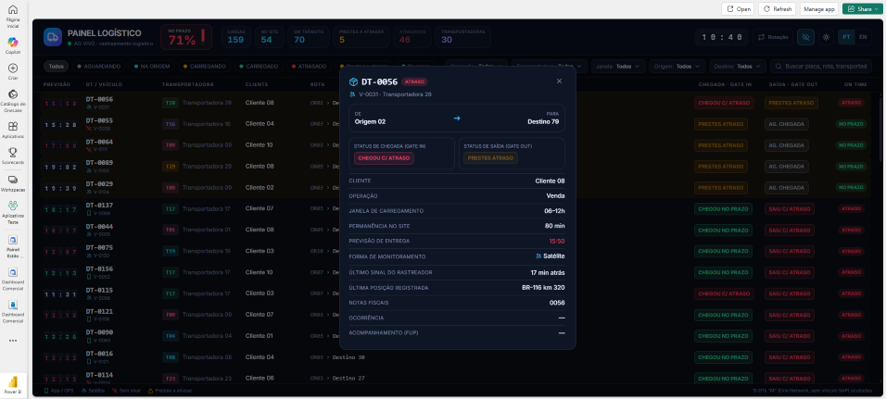
In the panel developed by DriveData, each shipment is presented through a consolidated view of information such as:
- expected arrival time;
- document and vehicle identification;
- carrier;
- customer;
- origin and destination;
- site arrival status;
- departure status;
- time-window compliance;
- GPS signal availability;
- estimated time to the next operational milestone.
The interface applies the concept of management by exception. Instead of requiring users to search through dozens of charts for potential problems, the system immediately highlights shipments requiring attention: delayed, approaching the deadline, without a tracking signal, or exceeding the permitted dwell time.
The result is an experience much closer to an operational system than a static report.
How to predict what is about to be delayed
A shipment does not need to be officially late to present a risk.
The forecast can be built by combining different variables:
- current vehicle position;
- remaining distance;
- observed average speed;
- estimated time of arrival, or ETA;
- scheduled time window;
- dwell time at the origin;
- route history;
- carrier performance;
- traffic and operational constraints;
- lost or outdated tracking signals.
Based on this information, the system continuously calculates the variance between the projected ETA and the operational time window.
This logic can be represented in a simplified form:
Delay risk = Projected ETA − time-window deadline
A mature solution, however, does not rely exclusively on this difference. It also considers data reliability, the last position received, the route’s historical behavior, and how the ETA evolves throughout the journey.
For example, a shipment may be two hours away from its destination and still formally appear as “on time.” However, if the average remaining travel time for that route is three hours, there is a high probability of noncompliance. At this point, the panel should change its status to “at risk of delay.”
The operation gains an intervention window in which it can:
- contact the carrier;
- confirm the vehicle’s condition;
- reorganize loading docks;
- reschedule teams;
- adjust the loading or receiving sequence;
- proactively notify the customer;
- reduce the impact of the delay across the supply chain.
This is the difference between recording a delay and managing the risk before it becomes an incident.
The architecture behind the Control Tower
For this experience to work, building a visual interface is not enough. It requires an architecture capable of integrating, processing, and delivering data with low latency.
One possible architecture within Microsoft Fabric combines four main layers.
1. Ingestion through APIs and events
Monitoring data can be consumed through APIs from tracking providers, TMS platforms, yard management systems, SAP, WMS platforms, driver applications, and telemetry devices.
When a source operates through periodic requests, Data Factory in Fabric pipelines can call REST APIs while managing authentication, pagination, and incremental data ingestion.
For truly event-driven scenarios, Fabric Eventstreams can capture, transform, and route continuous streams from technologies such as Azure Event Hubs, Azure IoT Hub, Kafka, Amazon Kinesis, and other sources. This shortens the time between an operational event and its availability for analysis. Official documentation describes Eventstreams as the component responsible for capturing, transforming, and routing real-time events within Fabric. Learn about Fabric Eventstreams.
Each position update can be treated as an event containing information such as:
- vehicle identifier;
- latitude and longitude;
- reading date and time;
- speed;
- direction;
- ignition status;
- journey status;
- signal quality or availability.
2. A unified data lake in OneLake
The events received are stored in OneLake, Microsoft Fabric’s unified data layer.
A Medallion architecture can organize this data into three levels:
- Bronze: raw events received from APIs and monitoring platforms;
- Silver: processed, standardized, deduplicated, and enriched data;
- Gold: consumption-ready operational indicators, such as ETA, delay risk, dwell time, time-window adherence, and carrier performance.
This separation improves traceability, data quality, and governance. It also preserves the original event, enables rules to be recalculated when necessary, and creates a single reliable source for operational and historical analysis.
3. Real-time processing
Fabric Real-Time Intelligence makes it possible to ingest, transform, store, analyze, and act on data in motion through an integrated experience. Events can be sent to a KQL database optimized for time-series queries and large volumes of telemetry data. See how Real-Time Intelligence works.
Within this context, rules can identify situations such as:
- a vehicle without a position update for longer than the acceptable limit;
- an ETA exceeding the scheduled window;
- an unplanned stop;
- a route deviation;
- excessive dwell time;
- an abnormal reduction in speed;
- an event sequence that is incompatible with the expected process.
With Fabric Activator, these conditions are no longer merely visual elements. The tool monitors data streams and can initiate actions when a rule or pattern is detected, including alerts and other automated processes. Learn about Fabric Activator.
The system can therefore alert the team as soon as the shipment enters the risk zone—not only after the deadline has already been missed.
4. Fabric Apps as an operational experience
Fabric Apps, currently presented by Microsoft as a Preview experience, expands the concept of analytics by enabling the development of managed data applications within Fabric.
The solution brings together capabilities such as hosting, databases, GraphQL APIs, authentication, and integration with the platform’s data assets. Fabric also manages infrastructure aspects such as networking and scalability, using Microsoft Entra ID for authentication. See the Fabric Apps overview.
In practice, this makes it possible to develop a Control Tower with a customized interface and application-like behavior: operational filters, vehicle search, status updates, incident creation, action tracking, and direct consumption of governed data within Fabric.
Instead of separately maintaining a data lake, an API layer, a portal, and an analytics environment, the company can consolidate much of this architecture within the same ecosystem.
An application that also captures operational decisions
One of the most important advances in this architecture is the ability for users not only to view data but also to record an action.
With Fabric User Data Functions, business rules written in Python can be made available as reusable functions executed by pipelines, notebooks, Activator rules, external applications, or REST endpoints. Learn about Fabric User Data Functions.
With Translytical Task Flows, it is also possible to create write-back experiences: users can update, add, or delete information in Fabric databases based on the context of a Power BI report. Understand Translytical Task Flows.
In a Control Tower, this capability can allow operators to:
- confirm an incident;
- record the reason for a delay;
- assign a responsible person;
- provide a new forecast;
- add a note;
- trigger a communication workflow;
- update the resolution status.
Data no longer moves in only one direction. The application monitors the operation, presents the risk, receives the user’s decision, and records the response for auditing and continuous improvement.
The case: a new way to view transportation operations
The experience developed by DriveData began with a simple question:
How can a team identify a critical shipment as quickly as it can identify a delayed flight at an airport?
The answer was to move away from pages overloaded with indicators and create a continuous operational view.
Within the same environment, leaders monitor consolidated service levels, while analysts view each shipment, its operational clock, origin, destination, responsible carrier, and risk of noncompliance.
Filters by operation, carrier, time window, origin, and destination help narrow the scope of analysis. Standardized colors and statuses accelerate interpretation. A countdown timer brings decision-making closer to real time.
More than modernizing the design, this approach changes operational behavior:
- delays are no longer a surprise;
- prioritization no longer depends on parallel controls;
- resolution begins before the impact occurs;
- leaders can view risk and execution within the same experience;
- incident history creates a foundation for increasingly accurate predictive analytics.
The main benefit is not simply improved visualization. It is increasing the amount of time available to make decisions.
The future of analytics is operational
Companies do not need another screen for observing problems. They need solutions that connect data, context, prediction, and action.
Fabric Apps, OneLake, Real-Time Intelligence, Eventstreams, Activator, Power BI, and User Data Functions form an architecture capable of transforming logistics data into an integrated operational experience.
The dashboard is no longer the final destination of the information.
It becomes the interface of an application that monitors operations, calculates risk, prioritizes incidents, engages people, and records decisions.
In transportation, a few minutes of advance warning can make the difference between managing an exception and explaining a delay.
How DriveData can support your operation
DriveData develops customized Data and Artificial Intelligence solutions, combining technical expertise, business insight, and practical experience in logistics operations.
We create Control Towers, Microsoft Fabric applications, API integrations, data architectures, automations, and advanced Power BI experiences—from data ingestion to the application used by the operation.
If your company still discovers delays after they happen, we can help transform this scenario.
Discover our solutions: www.drivedata.com.br
For professionals and companies that want to learn how to develop modern solutions using Power BI, Microsoft Fabric, Data Engineering, AI, HTML, DataViz, and analytical applications, DriveData Academy offers training connected to real-world projects and challenges.
Discover our training programs: academy.drivedata.com.br