
From Sales to Application: How Microsoft Fabric Apps Transforms Data into Business Decisions
From visualization to action: a new approach to transforming sales data into intelligence, diagnosis, and faster decisions.
By Tamires Cavani | August 18, 2026
In sales operations, for example, it is common for companies to have a CRM, spreadsheets, marketing tools, and multiple data sources. Managers can visualize revenue, conversion, pipeline, and targets, but they still need to interpret the numbers, identify where the problem lies, and decide what to do.
It was precisely from this challenge that we developed a different approach using Microsoft Fabric Apps: transforming BI from a query environment into a business-oriented application experience.
The Pain Point Was Not a Lack of Dashboards
Imagine a sales operation with thousands of leads, hundreds of opportunities, and multiple acquisition channels.
Management wants to know:
- Are we close to our target?
- Where is the bottleneck in the funnel?
- Which channel is generating the most revenue?
- Is average deal size increasing?
- Which salespeople need attention?
- Which deals could impact month-end results?
- Where is there a risk before it appears in the results?
The problem is not necessarily a lack of information.
The problem is the time between having the data, understanding the data, and making a decision.
In a traditional architecture, each new question can generate a new request for BI or technology teams. The dashboard answers what was previously planned, while the dynamics of the business continue to evolve.
The project's goal was precisely to reduce this gap.
What Changes with Fabric Apps?
Fabric Apps represents an important evolution within the Microsoft Fabric ecosystem: the ability to build data-driven applications, bringing data engineering, application development, and artificial intelligence closer together.
According to the technical analysis used as the foundation for this project, Fabric Apps is built on the Rayfin SDK and enables developers to build data-driven applications using TypeScript, abstracting a significant portion of traditional backend infrastructure. Based on the models defined in code, the platform can generate APIs, authentication, hosting, and integration with Fabric services.
In practice, this changes the development mindset.
Instead of simply asking:
“How do we build another dashboard?”
we start asking:
“How do we build an application that uses data to solve a real business need?”
And that difference is significant.
How Does It Work Technically?
One of the core concepts of Fabric Apps is model- and TypeScript decorator-based development.
Developers define entities, types, relationships, and rules using elements such as @entity(), @uuid(), @text(), and @role().
Based on these definitions, the environment can generate the data schema, GraphQL APIs, and authentication and authorization mechanisms, reducing the need to manually develop several traditional application layers.
The architecture also integrates components from the Fabric ecosystem itself.
These services include:
- SQL database in Fabric;
- authentication integrated with Microsoft Entra ID;
- static content hosting;
- data APIs;
- integrated OneLake storage.
The application's endpoint brings these services together within an integrated architecture.
Security is another important aspect.
Fabric Apps uses Fabric SSO with Microsoft Entra ID in deployed environments and supports role-based access control. Authorization can be defined through @role(), enabling row-level security scenarios.
In other words, we are not simply talking about placing a dashboard inside a different interface.
We are talking about an application built around data and business rules.
From KPI to Diagnosis
In the project analyzed, the sales application was designed to answer both strategic and operational questions.
At the strategic level:
Are we growing? Where is the risk?
At the tactical level:
Where are the bottlenecks and inefficiencies?
And at the operational level:
What needs to be done today? Who needs intervention?
This structure matters because a good data project does not start with a chart.
It starts with a business question.
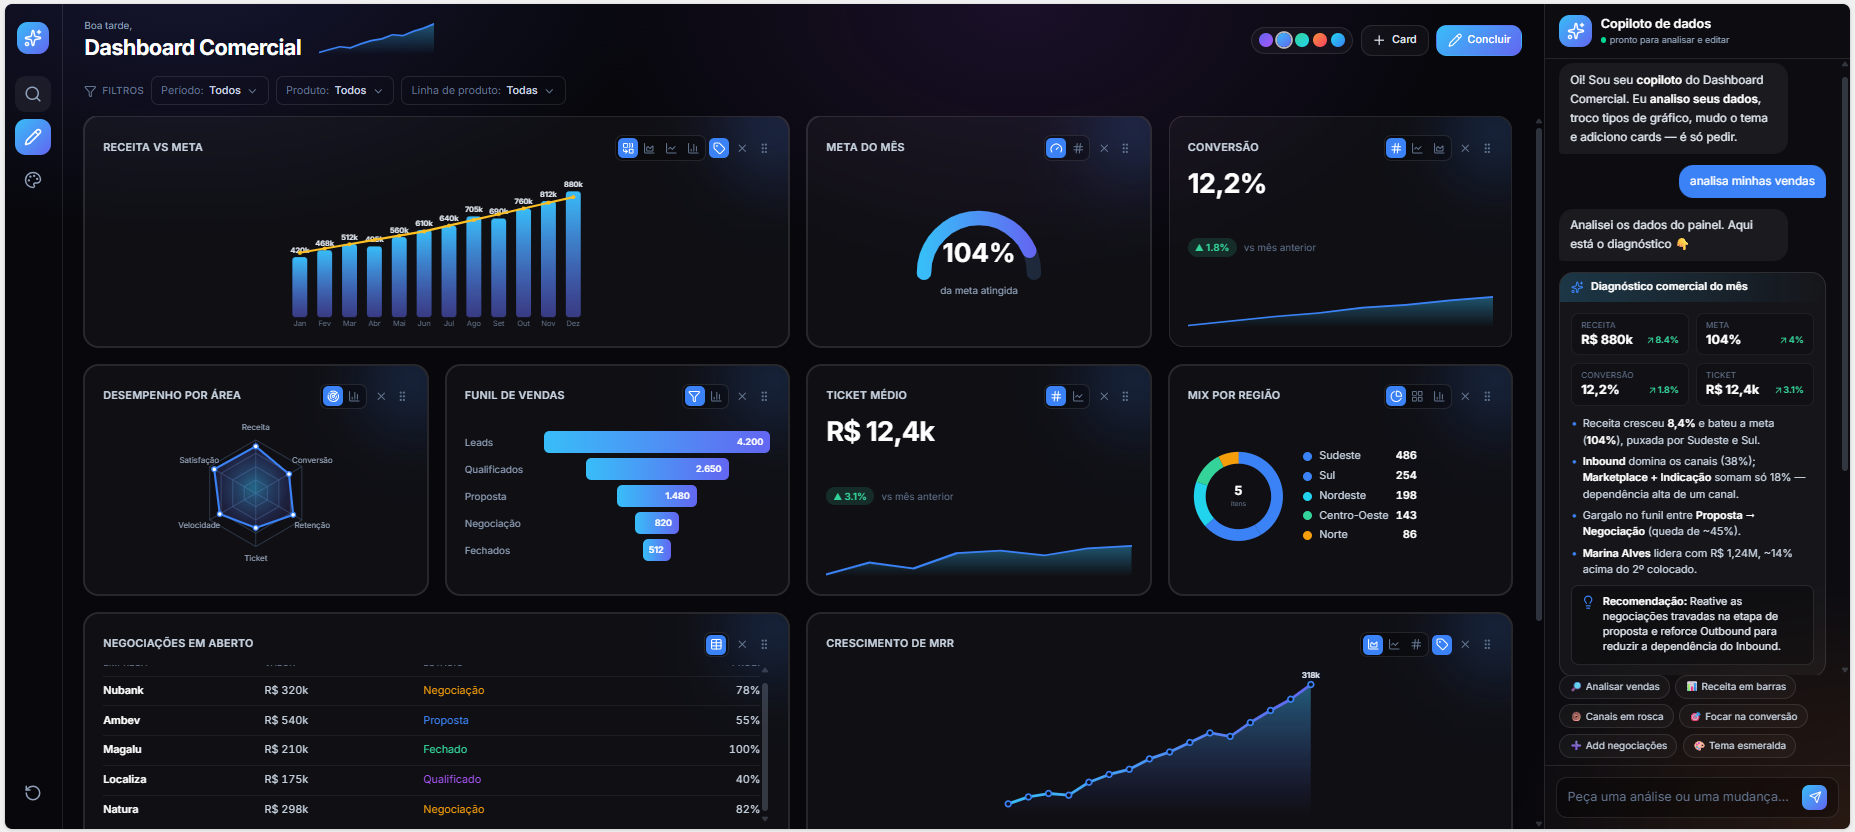
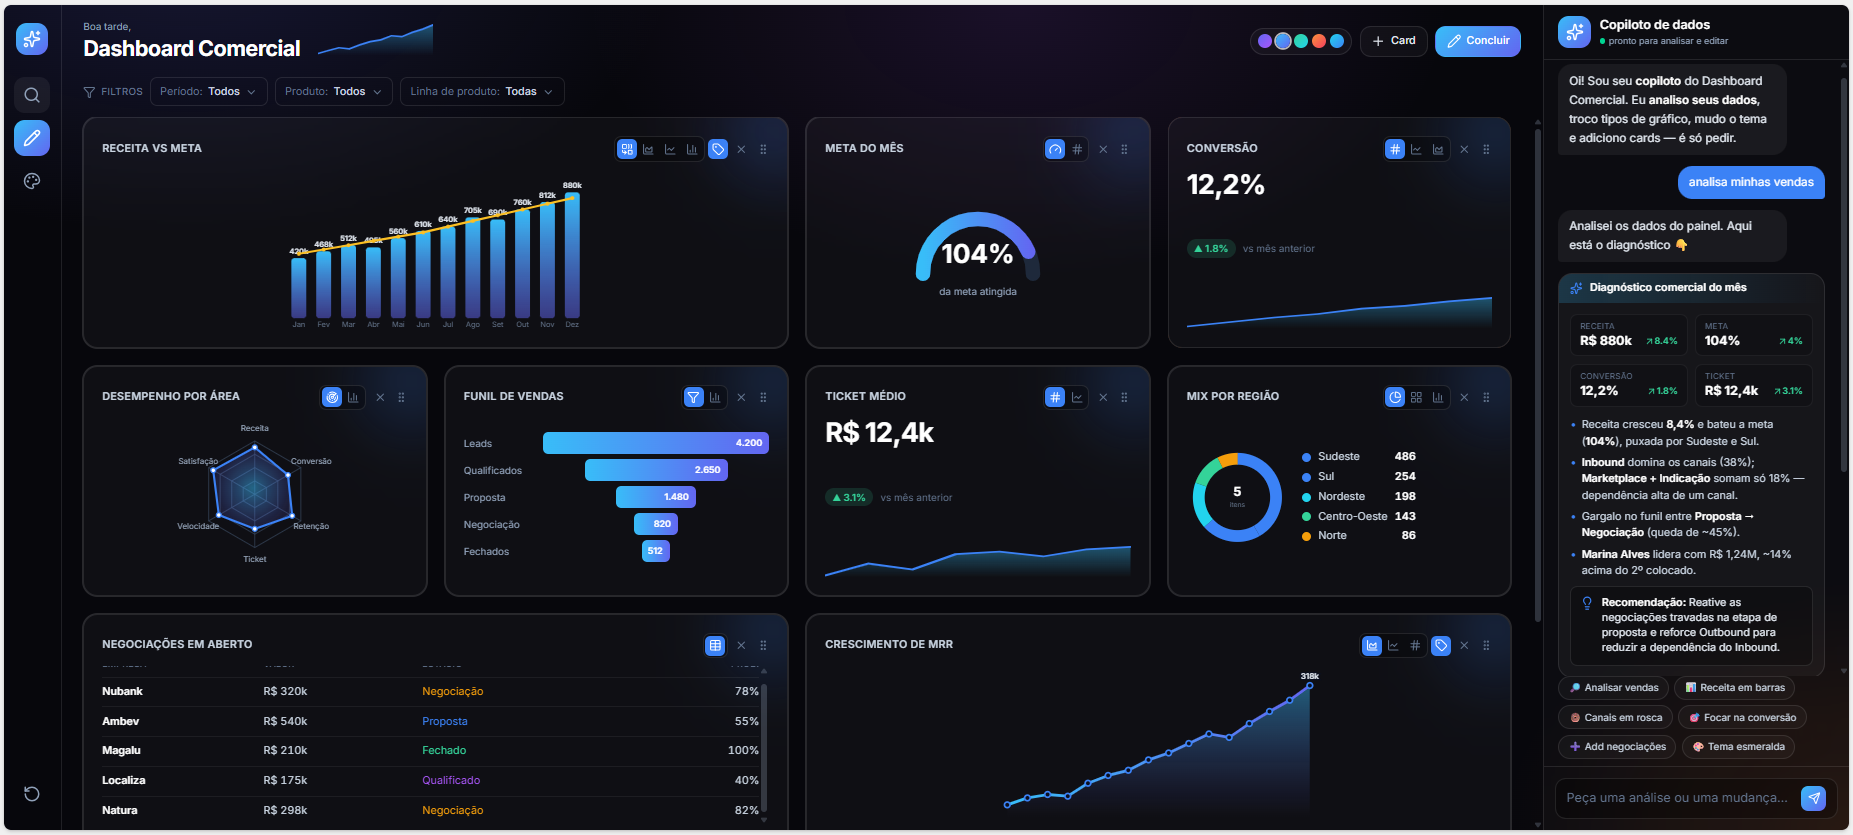
The application brings together indicators such as revenue versus target, sales funnel, MRR, conversion, average deal size, channel mix, regional distribution, salesperson performance, and open opportunities.
But the real differentiator is not stopping at visualization.
When AI Stops Being a “Chat” and Starts Working with the Business
One of the most interesting capabilities demonstrated in the project is the Data Copilot.
Instead of simply presenting numbers, the AI layer can analyze performance, highlight areas requiring attention, explain specific indicators, and assist in creating or modifying visualizations.
For example:
A decline in average deal size can be identified as an area requiring attention.
An excessive concentration of revenue in a particular channel may represent a risk.
A conversion bottleneck in the sales funnel may indicate the need to review training, sales approach, or ICP definition.
The sales analysis demonstrates precisely this capability: the Copilot can generate diagnoses, explain channel contribution, and create or modify visualizations using natural-language commands.
This creates an important paradigm shift:
The dashboard shows what happened.
The application helps explain why it matters and where to act.
Exception-Based Management: Managers Don't Need to Look at Everything
There is another concept we consider particularly relevant.
A manager should not have to spend hours searching for deviations across dozens of KPIs.
Technology should help identify what deserves attention.
In the project, the application follows an exception-based management approach, highlighting what improved, what deteriorated, and which indicators represent risk. This directs the manager's attention toward the areas that actually require a decision.
This changes the role of BI.
The goal is no longer:
“Here are your numbers.”
It becomes:
“Here are the numbers that require your attention.”
Why Is This Different from Simply Building a Power BI Report?
Power BI remains an excellent tool for analysis and visualization.
The question is different.
For some projects, a dashboard is enough.
For others, the business needs an experience that is closer to an application: with persistent data, rules, authentication, different access profiles, interaction, business logic, and the ability to incorporate AI capabilities.
This is where Fabric Apps becomes particularly interesting.
The technical analysis itself identifies internal applications, rapid prototyping, administrative dashboards, and AI applications with persistent state as suitable use cases. At the same time, there are important limitations, including scenarios requiring complex transactions, stored procedures, or certain relationship models.
In other words: Fabric Apps is not a universal replacement for every software architecture.
It is a new architectural option for specific types of problems.
And knowing when to use it is just as important as knowing how to develop with it.
The Real Value Lies in the Project, Not the Technology
It is easy to turn a new technology into a sales pitch.
What is harder is knowing where it actually creates value.
In practice, a project like this needs to start with the pain point:
Which decision is taking too long?
Which process depends too heavily on manual intervention?
Where is the business losing money due to a lack of visibility?
Which information is scattered across different sources?
Which decisions still depend on spreadsheets?
What should the manager know before even asking?
Only then does technology come into the picture.
In our view, this is the difference between implementing Fabric Apps and using Fabric Apps to transform a business process.
This Is Where DriveData Comes In
At DriveData, our work does not start by choosing a tool.
It starts by understanding the problem.
Based on the identified business challenge, we evaluate data architecture, integrations, KPIs, user experience, security, automation, and artificial intelligence to define the most appropriate solution.
Fabric Apps expands this toolkit.
It enables the development of data-driven applications connected to the Microsoft Fabric ecosystem and creates an interesting bridge between data, applications, and AI. The technical analysis highlights precisely this integration with OneLake, Power BI, and Data Factory as one of the platform's key potentials.
And this is the central point:
We don't sell dashboards.
We don't sell technology for technology's sake.
We build solutions for real business problems.
If your company already has data, dashboards, and tools, but still feels that decisions remain slow, manual, or dependent on a few key people, perhaps the next step is not to create another report.
Perhaps it is time to transform your process into an intelligent application.
DriveData can help you design this journey — from business pain to architecture, from data to application, and from information to decision.