
Your distribution center has the data. But can you see where the operation is getting stuck?
The problem is not just moving goods. It is seeing the operation.
By Tamires Cavani, 10/13/2026
A truck is waiting to be loaded. The picking team needs to locate certain pallets. One aisle shows an operational interruption, while another concentrates a large part of the occupied positions.
The WMS records the products. The ERP centralizes information. The reports show indicators.
But, to understand what is happening, the supervisor still needs to consult different screens, cross information, and talk to several people.
The problem is not necessarily the lack of data. It is the difficulty of turning that data into a clear view of the physical operation.
This is a significant pain point for distribution centers, logistics operators, wholesalers, and industries with large storage structures.
The larger the operation, the harder it becomes to simultaneously monitor positions, sectors, movements, teams, and shipping areas.
And when information arrives without context, the manager may discover a problem without being able to quickly identify where to investigate.
An operation you can see, not just consult
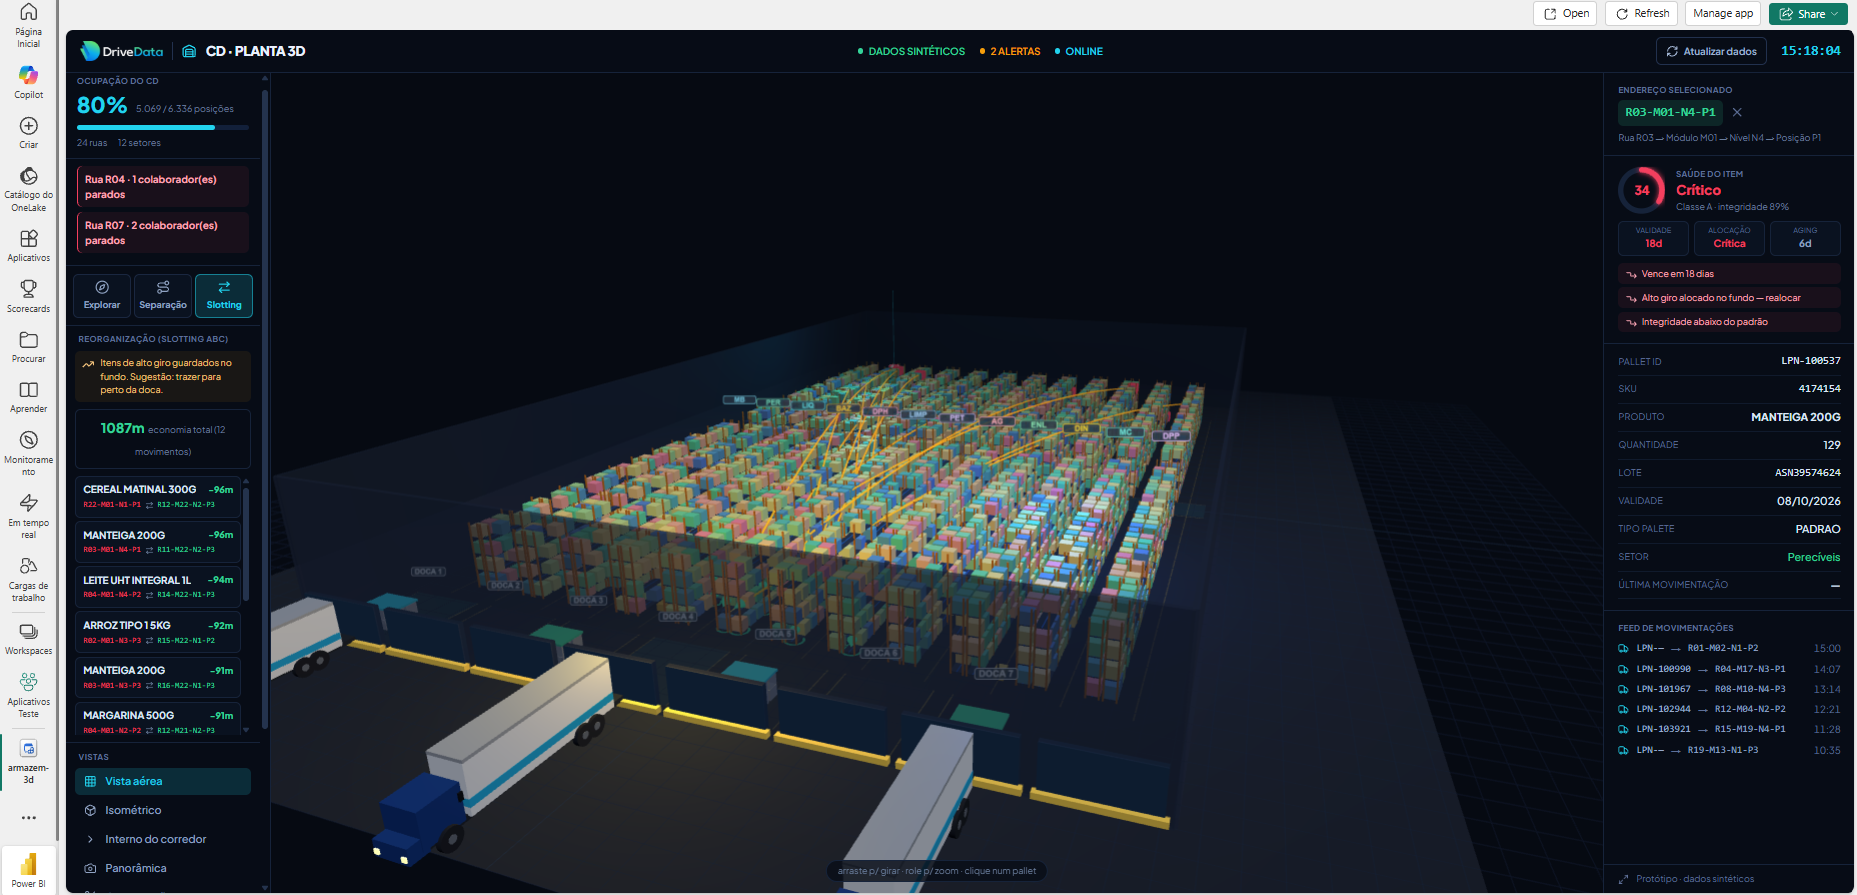
To explore a response to this challenge, DriveData developed the DC · 3D Plant, a prototype of three-dimensional logistics visualization made available through Microsoft Fabric Apps.
The proposal is to transform warehouse data into a visual representation of its physical structure.
Instead of consulting only addressing codes and occupancy tables, the manager can visualize the organization of the distribution center, its aisles, sectors, storage structures, and pallets in a single interface.
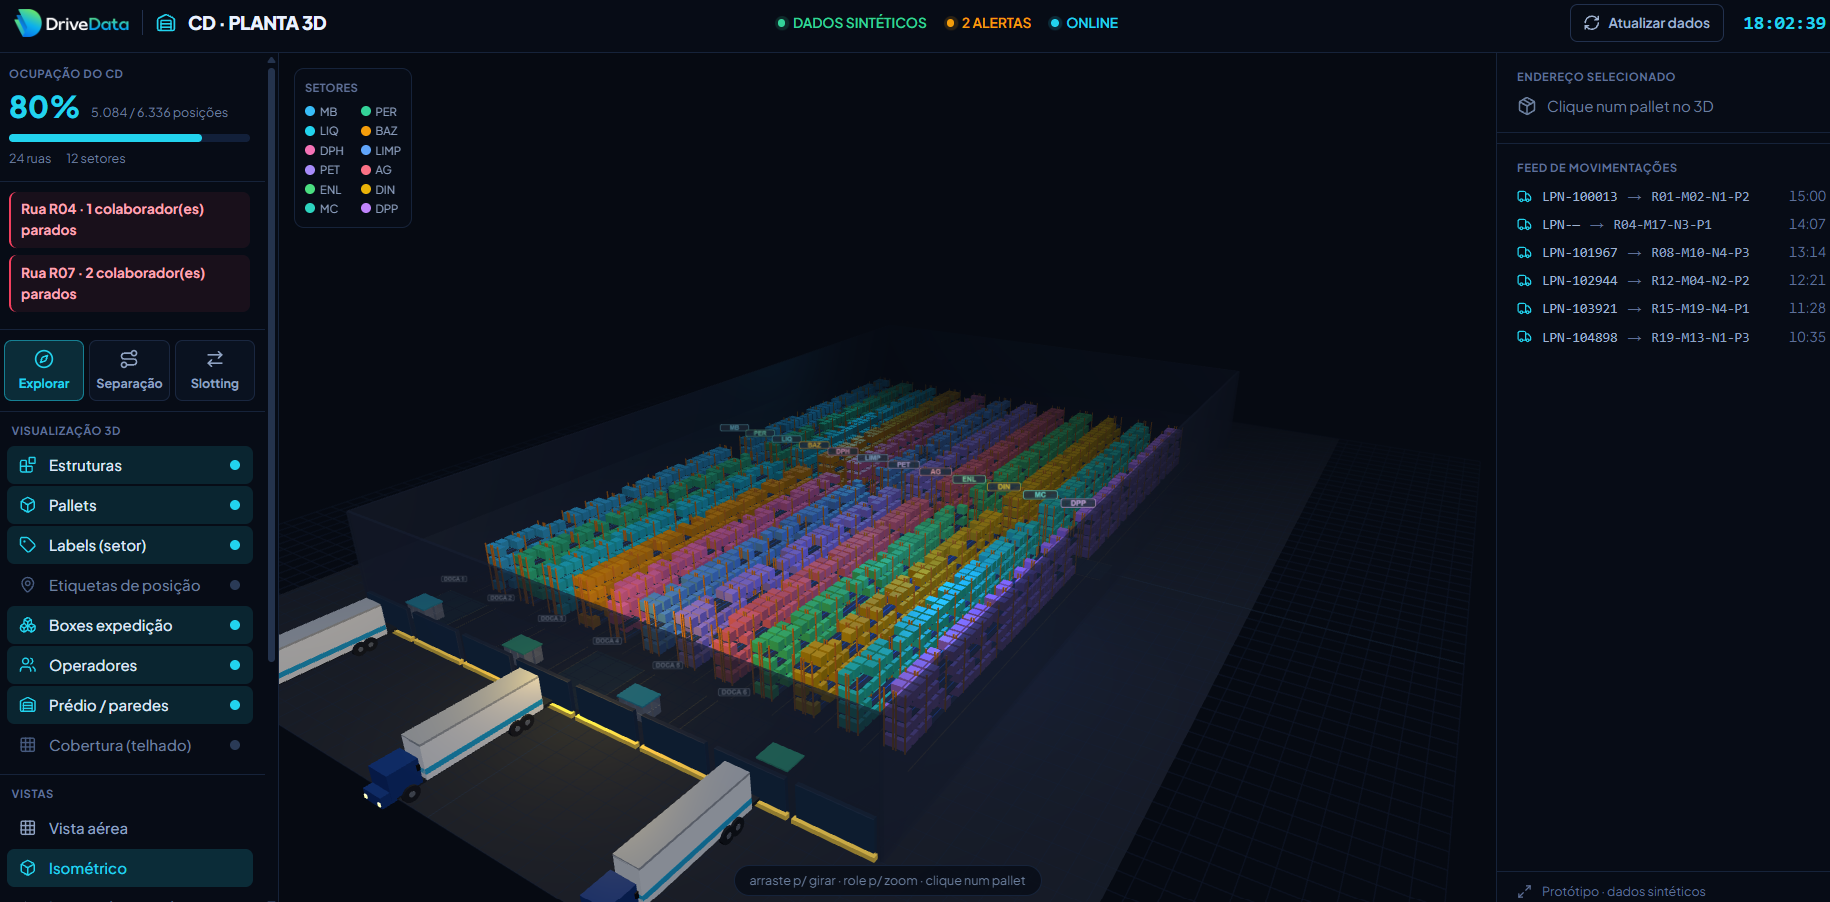
In the demonstration, built with synthetic data, the plant represents a distribution center with 6,336 storage positions, of which 5,084 are occupied, distributed across 24 aisles and 12 sectors.
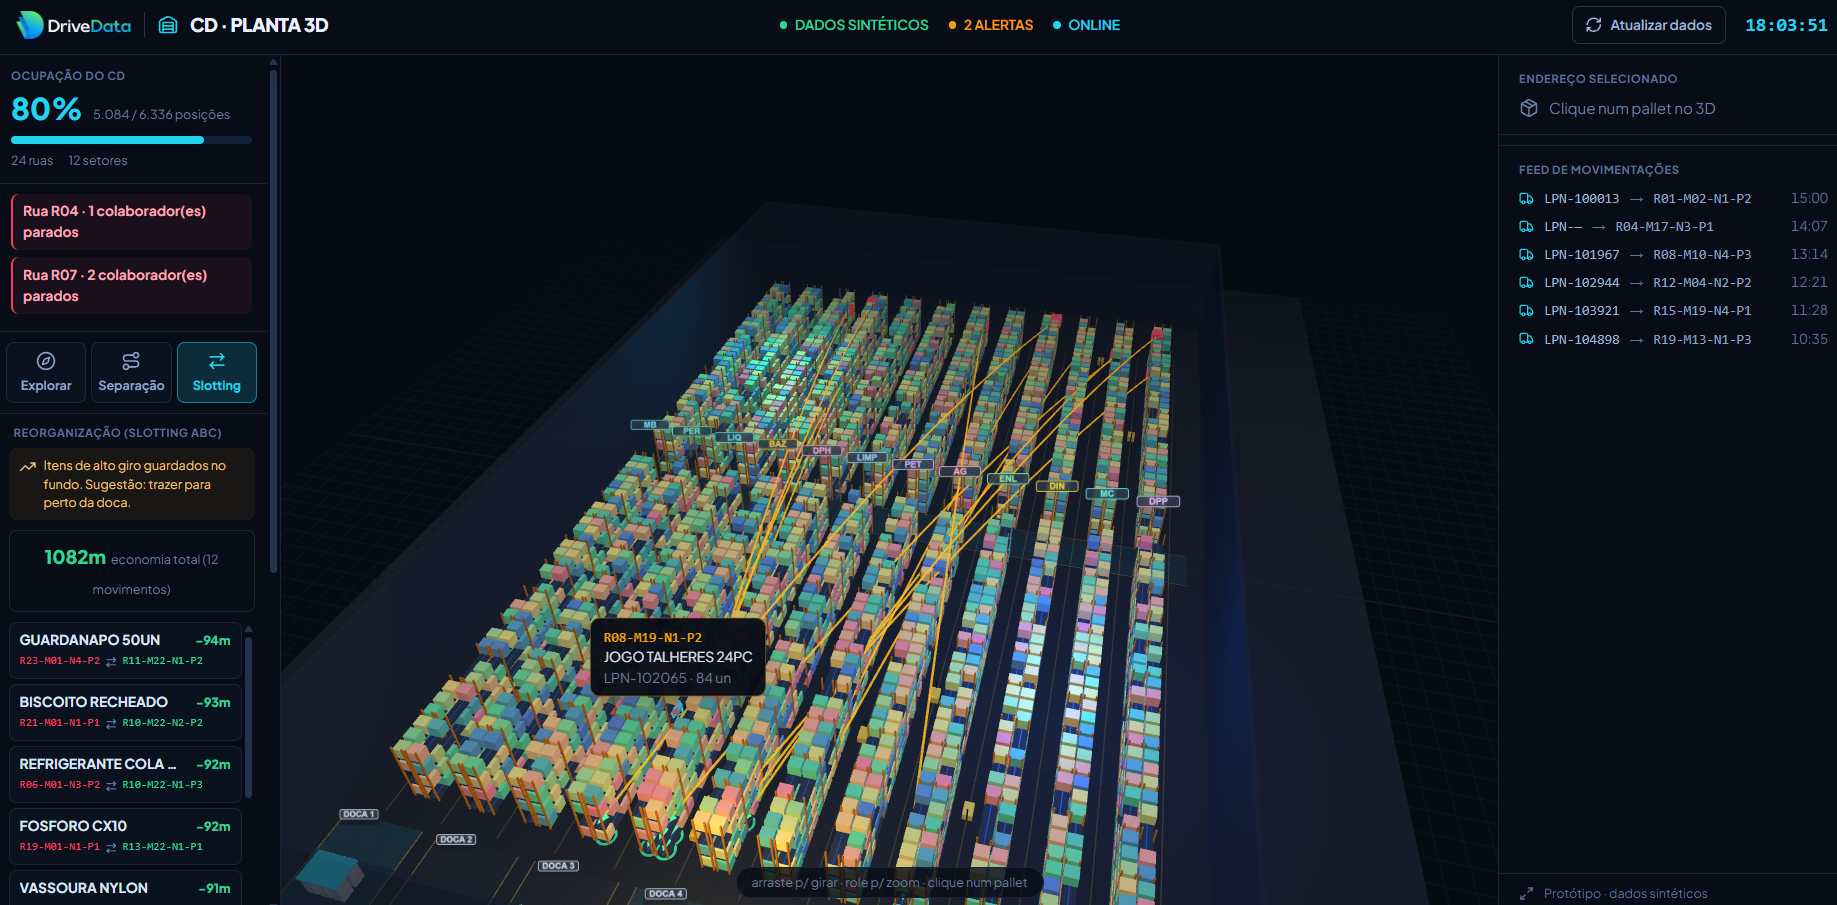
The environment also presents alerts associated with specific aisles, a movement feed with pallet identifiers, addresses, and times, as well as visualization controls and modes identified as Explore, Picking, and Slotting.
These features demonstrate a different way to consume logistics information: associating indicators and records with the physical environment where activities take place.
What does this change for the logistics manager?
Identify where the operation deserves attention
Imagine receiving an alert informing that a certain aisle has an operational interruption.
In a traditional report, the manager sees the occurrence and needs to seek additional information to understand its location and context.
In a three-dimensional interface, this information can be associated with the warehouse's physical structure.
DriveData's prototype already presents alerts by aisle, creating a visual base for this type of monitoring.
With appropriate operational rules and integrations, this approach can support bottleneck investigation, direct supervisory attention, and reduce the effort needed to contextualize occurrences.
The goal is not just to warn that there is a problem. It is to help understand where it is and what needs to be checked.
Understand occupancy beyond a percentage
A DC with 80% occupancy seems to have available capacity.
But this isolated information does not answer important questions.
Are the free positions properly distributed? Are there more pressured sectors? Does the product location favor picking? Are there opportunities to reorganize storage?
The 3D visualization adds spatial context to the analysis.
By representing aisles, sectors, and positions, it creates a basis to investigate stock distribution and support storage decisions.
This is especially relevant for operations with a wide variety of products, different movement characteristics, and constant need for reorganization.
Facilitate pallet location and traceability
In logistics operations, quickly locating a load unit is essential to maintain activity continuity.
When the query depends on navigating between codes, spreadsheets, and systems, the investigation work can consume the team's time.
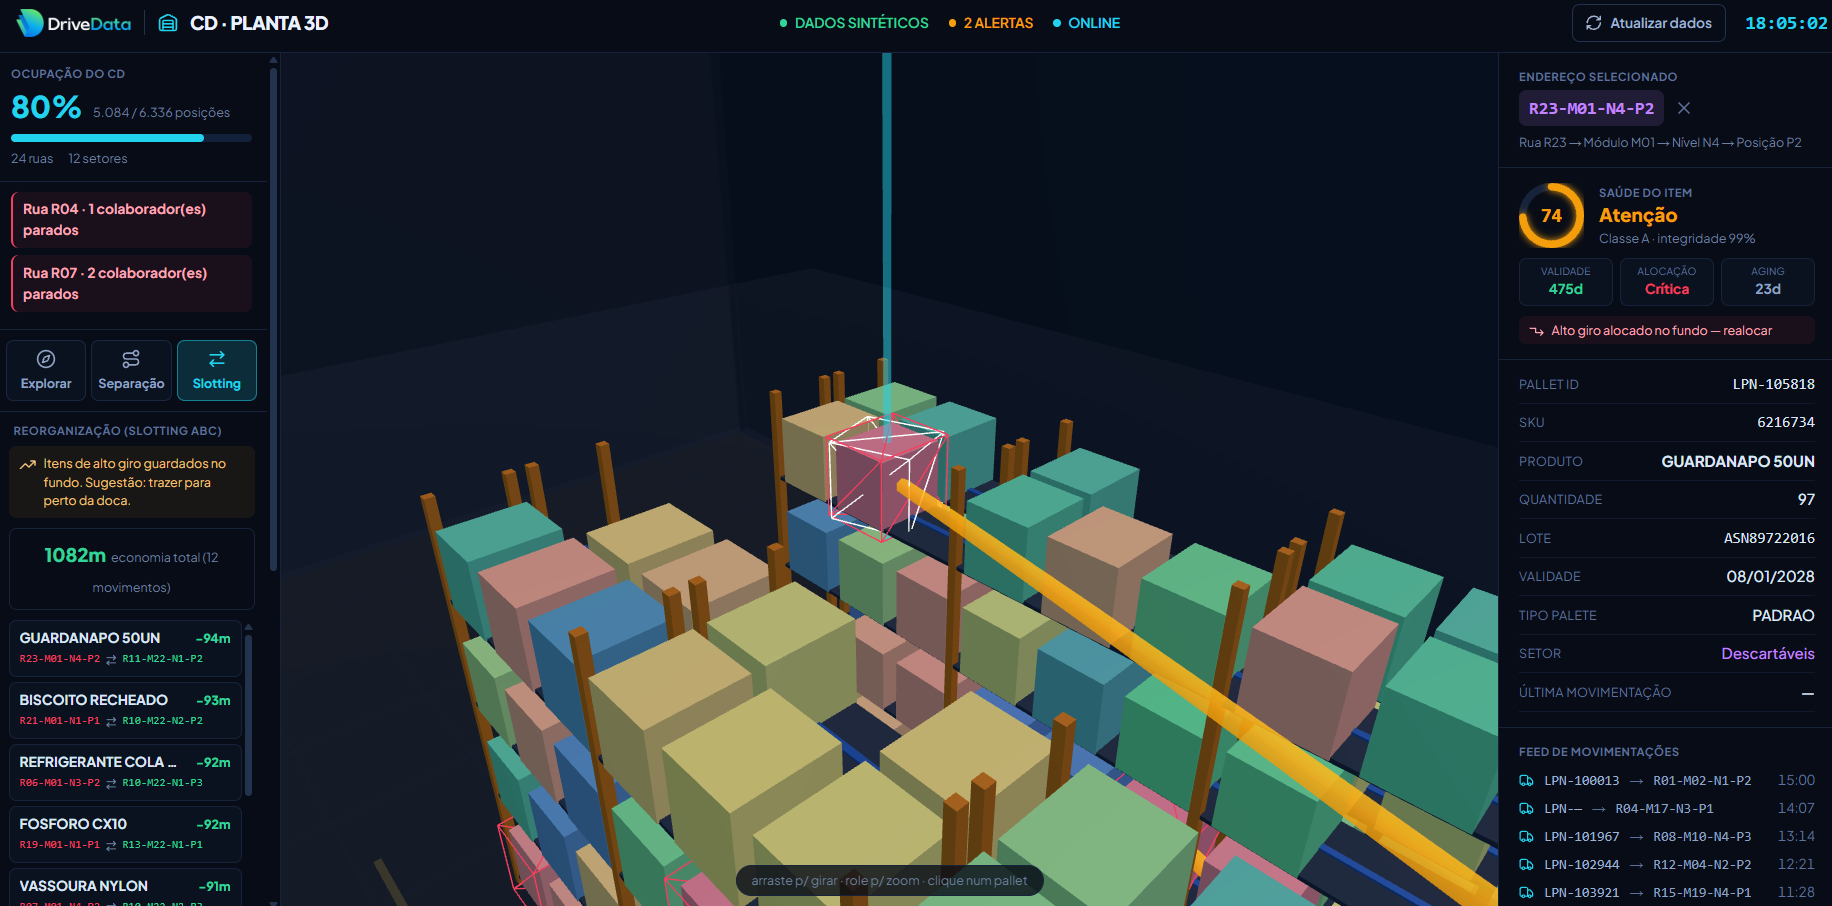
The prototype presents position identification and a movement feed with LPN codes, destinations, and times, as well as an interface prepared for pallet selection on the 3D plant.
In an implementation integrated with the WMS, these elements could support visual queries of addressing and movement history.
The opportunity lies in bringing the information recorded in the system closer to the physical location the team needs to understand.
Support picking and stock organization decisions
Picking efficiency depends on factors such as product location, demand distribution, routes, position availability, and item characteristics.
The prototype includes modes identified as Picking and Slotting, pointing to possibilities for experience evolution.
With appropriate data and rules, an application of this type can support product positioning studies, route analysis, and identification of reorganization opportunities.
It is not about replacing the WMS or automatically guaranteeing an optimized route.
It is about creating a visual layer that facilitates space understanding and supports decisions on how to use it better.
Why use Microsoft Fabric Apps?
A technological differential of this project lies in how the experience was built and made available.
Microsoft Fabric Apps allows developing customized web applications driven by data within the Microsoft Fabric ecosystem.
This expands possibilities compared to a traditional indicator dashboard.
Instead of limiting the experience to charts and tables, it is possible to develop interfaces specific to the business reality, such as a three-dimensional plant of a distribution center.
The Fabric ecosystem also offers technologies for integration, storage, processing, and data analysis, which can be part of the architecture of a corporate solution.
In a production project, the choice of these integrations would depend on existing systems, security requirements, update frequency, and operational needs.
Fabric Apps is currently in preview, which requires technical evaluation before its use in critical processes.
The great opportunity is not to replace the systems the company already uses, but to build an experience that makes its information more accessible, understandable, and useful for the operation.
From data to decision. From decision to action.
A distribution center does not improve its efficiency simply because it has more dashboards.
The potential gain appears when information helps people perceive a situation, understand its cause, and coordinate a response.
This is the change DriveData seeks to explore with the DC · 3D Plant.
The demonstration brings together occupancy, physical structure, addressing, movements, and alerts in a visual experience.
The evolution to a complete operational solution may include integration with corporate systems, event updates, business rules, bottleneck analysis, and controlled response flows.
All this needs to be scaled according to the reality of each distribution center.
The proposal is clear: reduce the distance between what is recorded in the systems and what the manager needs to see to coordinate the operation.
Does your logistics need more reports or a better view of what happens in the warehouse?
For companies with complex storage and distribution operations, lack of visibility can hinder bottleneck identification, capacity utilization, and coordination among teams.
Three-dimensional visualization is a possibility to bring technology and operation closer, especially when combined with reliable data and well-defined processes.
At DriveData, we develop data solutions, operational intelligence, automation, and custom applications to help companies transform information into clearer decisions and more connected processes.
The DC · 3D Plant demonstrates how this approach can be applied to the logistics environment.
Explore the demonstration and discover how an integrated visual experience can make sense for your distribution center's reality.
Note: the presented application is a prototype with synthetic data. Indicators and alerts are demonstrative, and the described benefits are potential opportunities.