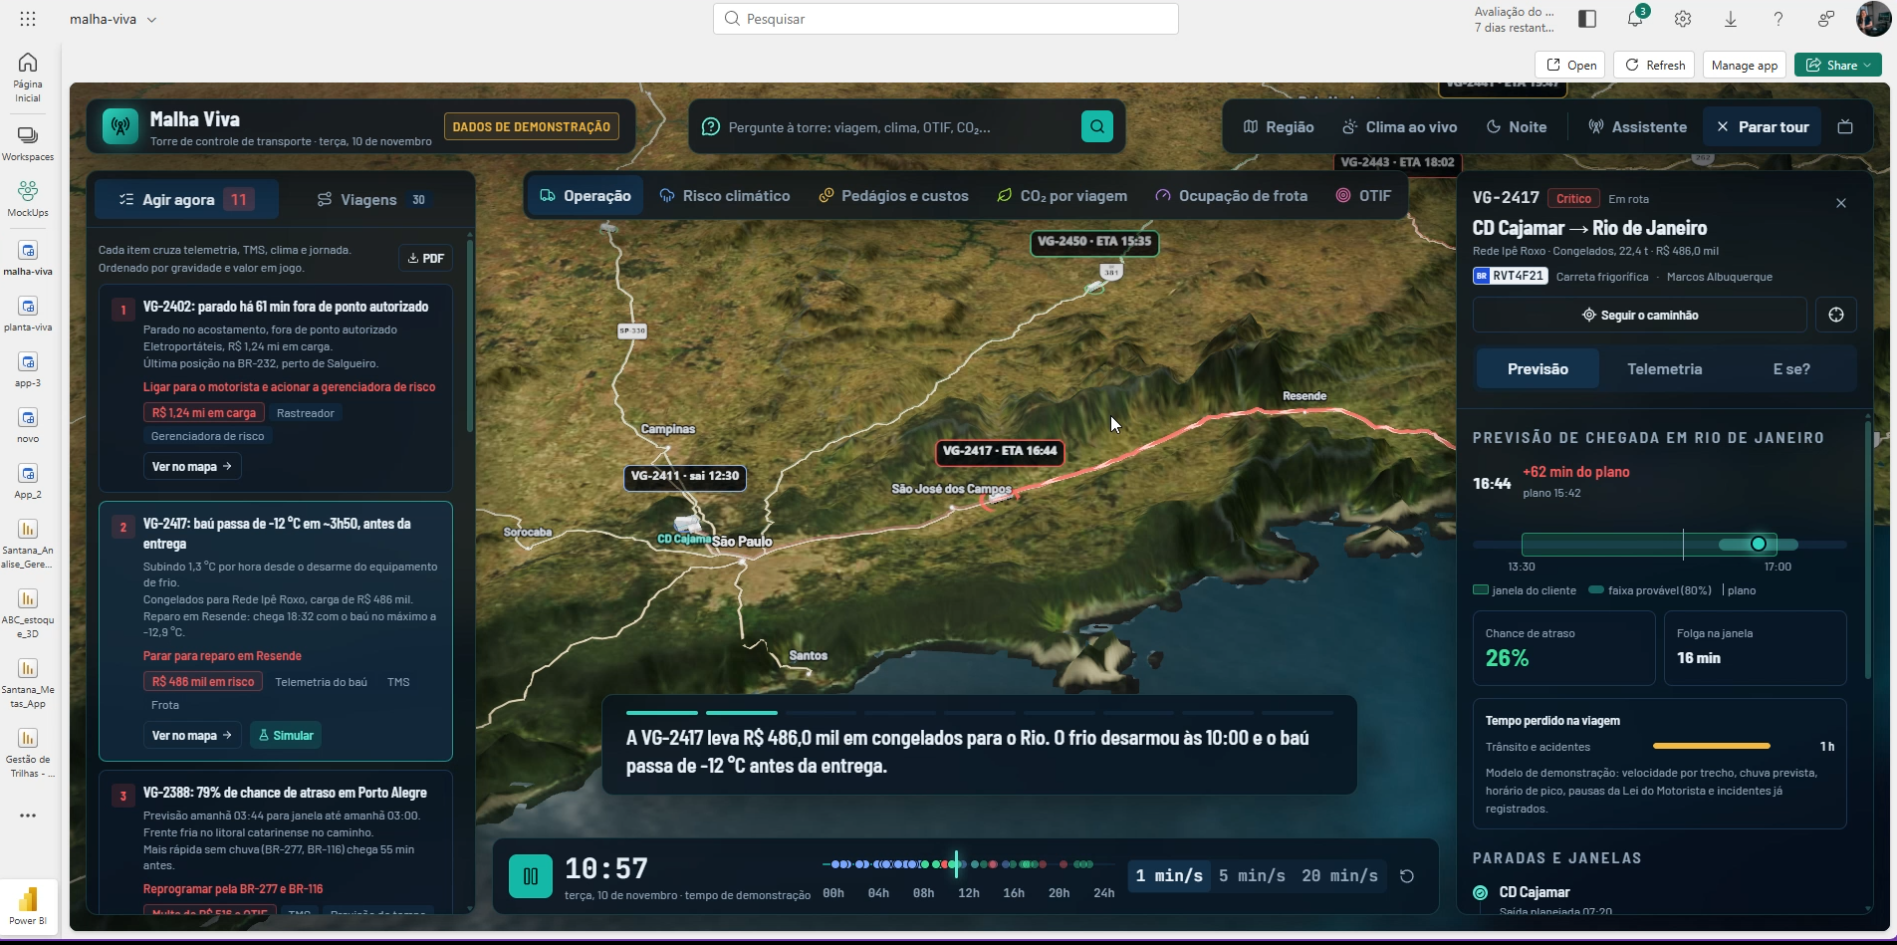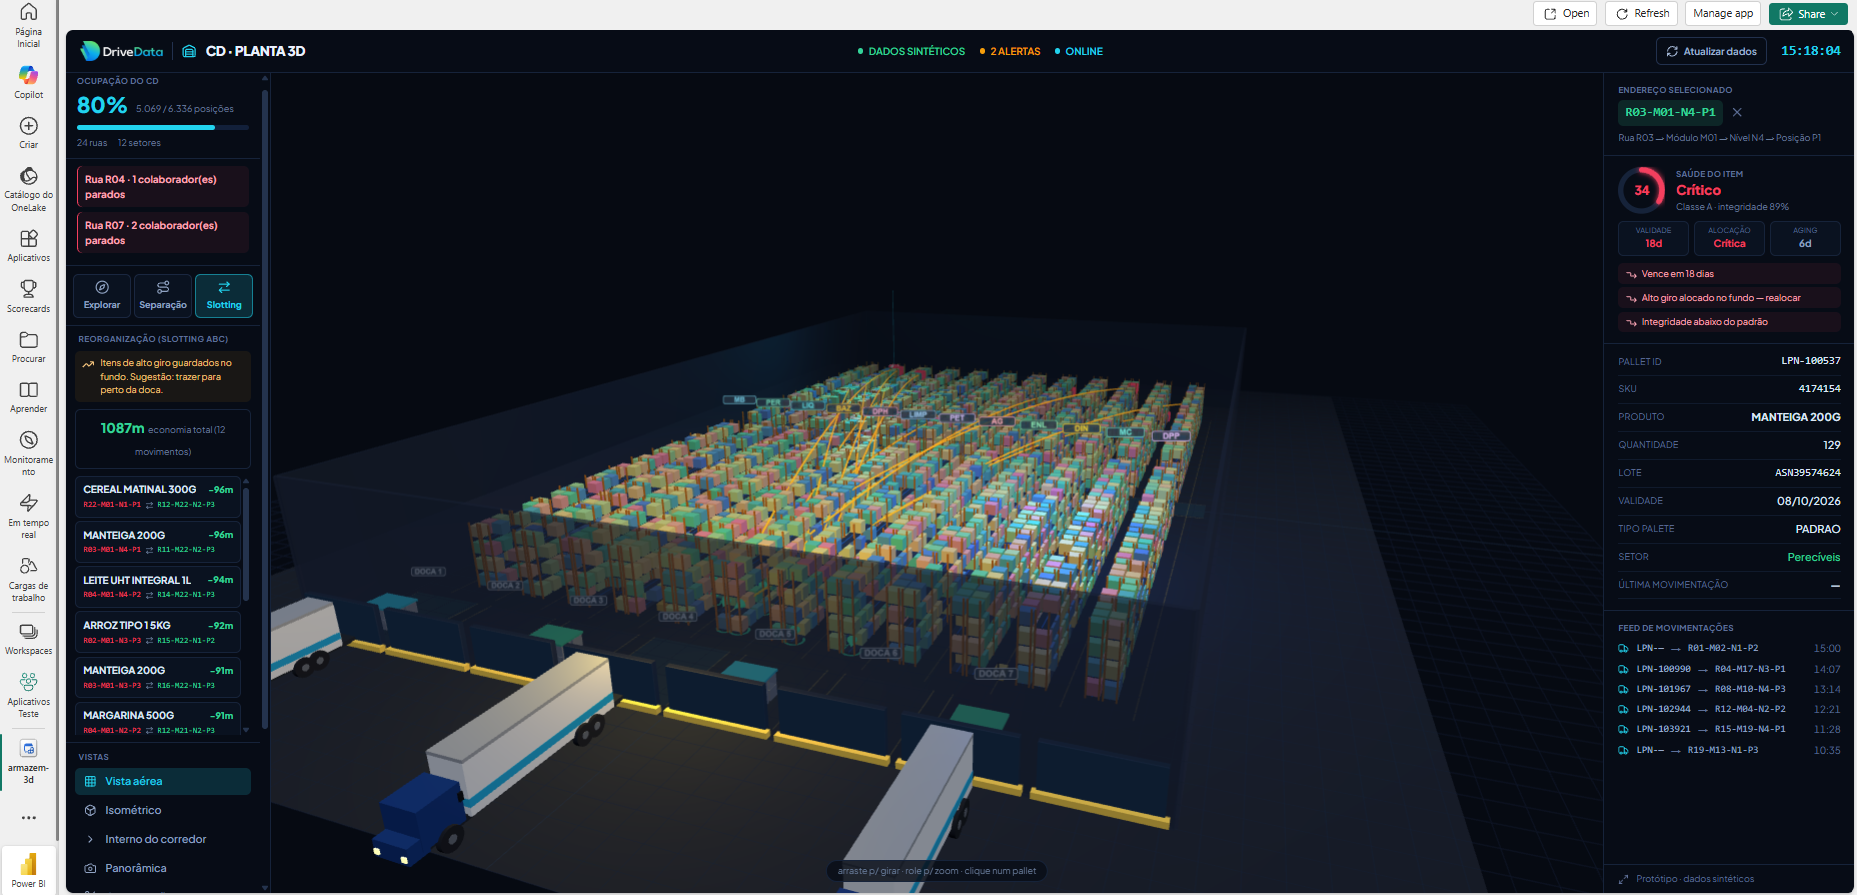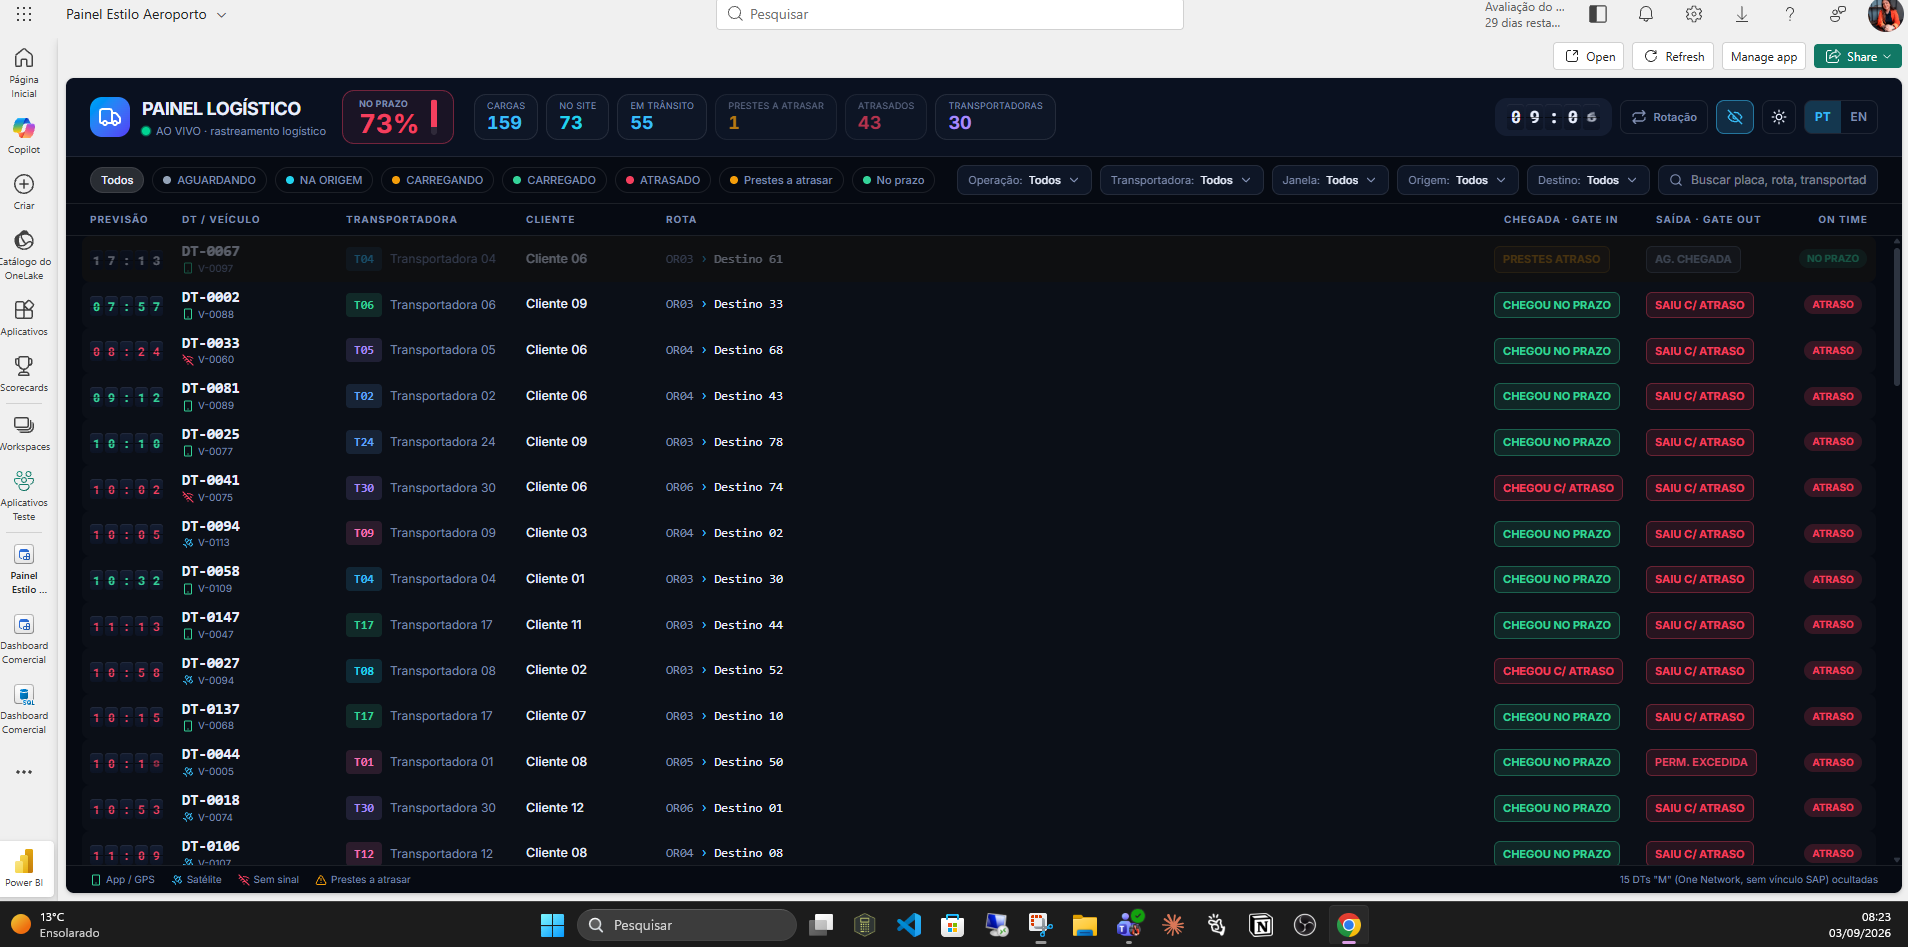

Stock X-Ray: how to turn logistics data into decisions that reduce stockouts, excess inventory, and idle capital
From inventory accuracy to demand forecasting: how to integrate data, operational intelligence, and simulations to improve inventory and distribution center management.
The stock may be full and yet your company can still lose sales
Imagine an operation with two distribution centers.
In one of them, certain products remain stored for months without significant movement. In the other, the same items are at risk of stockout.
While procurement analyzes suppliers and commercial terms, logistics monitors physical availability, receiving, and picking. Finance looks at the committed capital, and sales aims to ensure demand fulfillment.
Each department has important information. But these pieces of information are not always connected.
The result can be a set of decisions that seem correct in isolation, but create imbalances in the supply chain:
- Purchases made without considering the stock available across the network.
- Low-turnover products receiving new orders.
- Stockouts identified too late for conventional replenishment.
- Transfers between DCs carried out without financial assessment.
- Discrepancies between physical and system inventory balances.
- Working capital tied up in low-demand products.
The problem is not necessarily a lack of stock. It is the lack of an integrated view of availability, need, and cost.
This is precisely the view that a logistics intelligence solution needs to provide.
What is the Inventory X-Ray?
The Inventory X-Ray is an analytical approach to monitor inventory health and support operational and financial decisions.
Its goal is to go beyond traditional indicators such as stocked quantity, turnover, and occupancy.
Instead of showing only the available balance, the application organizes information to answer questions such as:
- Which products are at risk of stockout before the next delivery?
- Where are there recurring inventory discrepancies?
- How much capital is tied up in low-turnover products?
- Which purchase orders need to be reviewed?
- Is the same product available in another distribution center?
- What is the expected impact of anticipating, cancelling, or transferring goods?
The proposal is to combine three levels of intelligence:
Visibility: understand what is happening.
Diagnosis: identify where the deviations are and which factors may explain them.
Simulation: evaluate possible decisions before executing them.
This structure brings Business Intelligence closer to the daily needs of logistics operations.
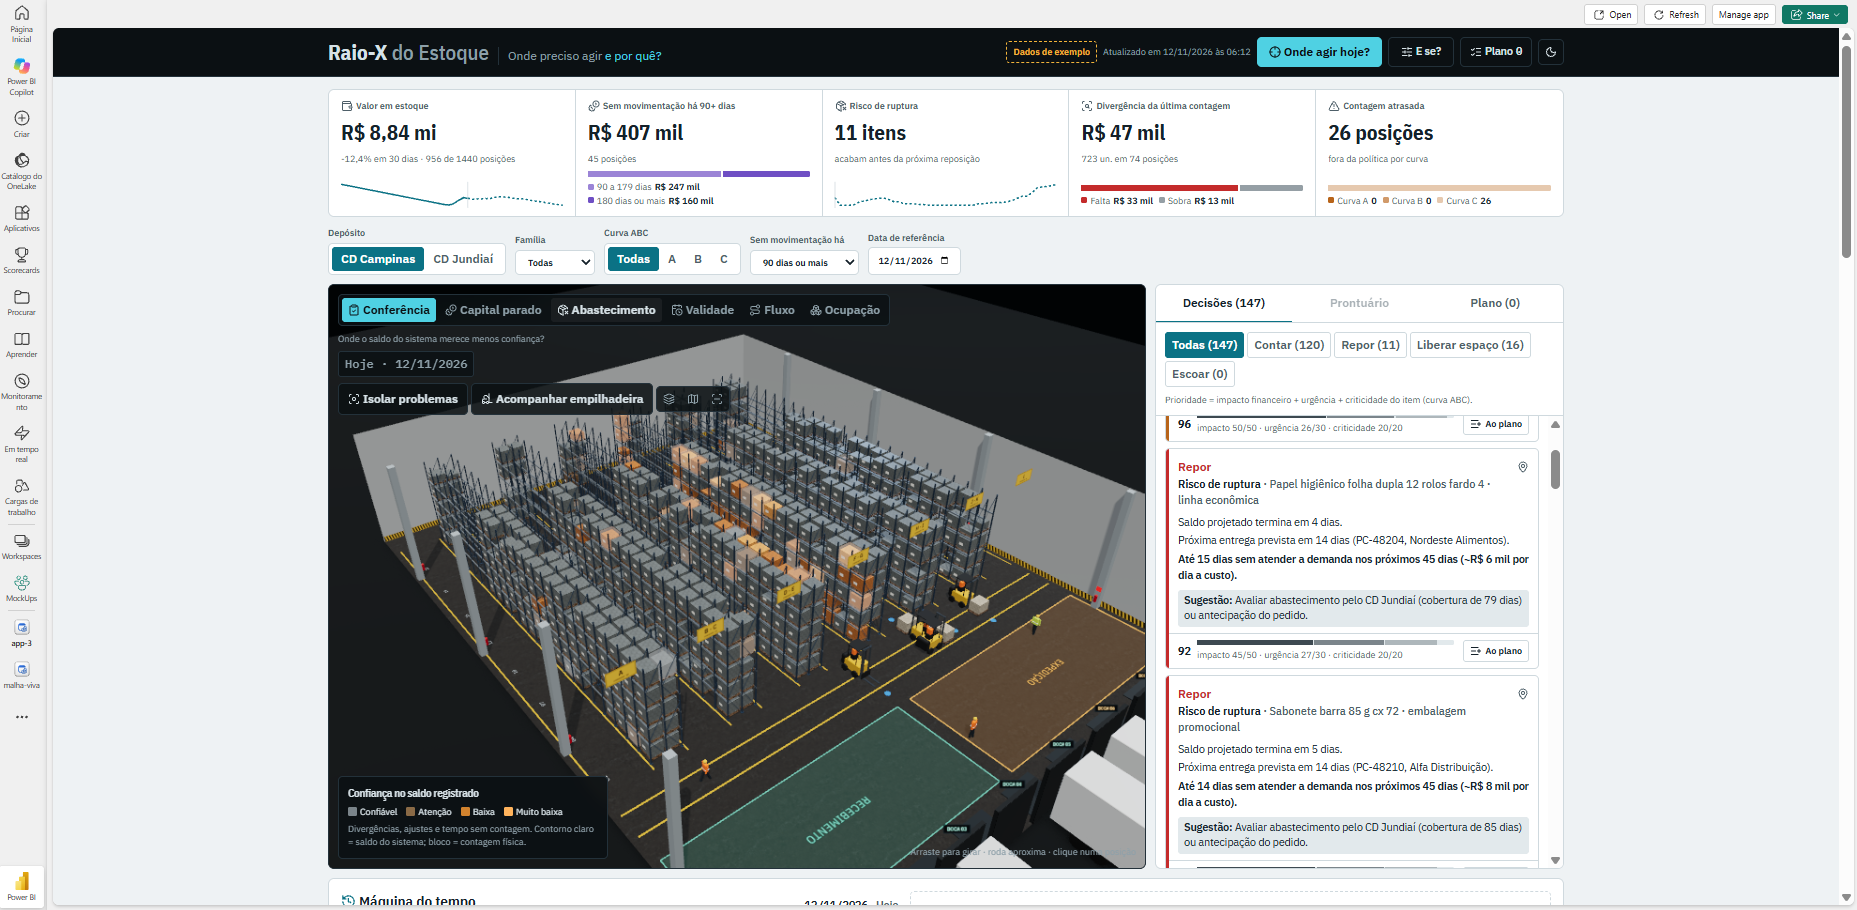
A decision-oriented demonstration
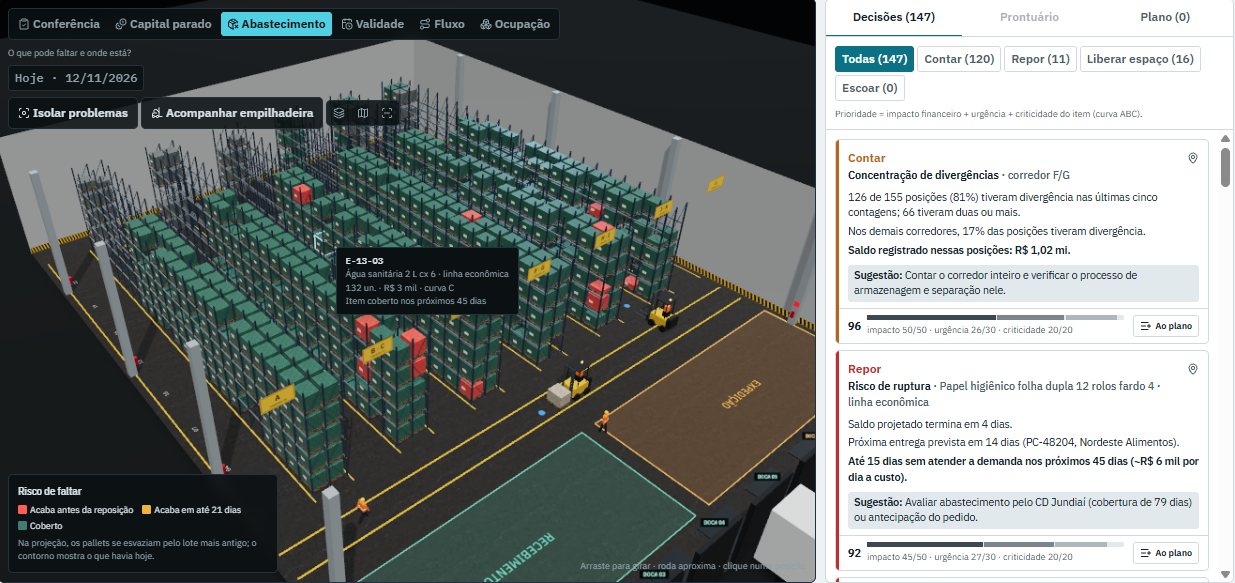
To illustrate the approach, consider the demonstrative scenario of the Inventory X-Ray, with fictitious data:
| IndicatorDemonstrative value | |
| Aisle F/G positions with discrepancies in the last five counts | 84% |
| Products at risk of stockout | 3 |
| Capital associated with idle items in one DC | R$ 407 thousand |
| Products with coverage over 90 days | 11 |
| Occupancy of one DC | 27% |
| Simplified demand projection | Average of the last 28 days |
Note: the numbers above are demonstrative data provided to illustrate how the analysis works. They do not represent proven customer results or gains achieved with an implementation.
The value of this approach lies in the ability to connect each indicator to possible business actions.
An inventory discrepancy should not just trigger a new count. It needs to drive investigation.
A stockout should not automatically trigger an emergency purchase. It is necessary to evaluate coverage, lead time, availability in other DCs, and the cost of alternatives.
And idle stock does not necessarily represent a space problem. It may mainly represent a financial problem.
Inventory accuracy: the data must reflect the physical stock
One of the biggest challenges in inventory management is ensuring that the quantity recorded in the system matches the quantity actually available.
When there is a discrepancy between physical and system inventory, virtually all subsequent analyses can be compromised.
A product may appear available for sale without being physically accessible. Another may be reordered because a movement has not yet been recorded.
How to measure accuracy
One way to track position accuracy is to use the indicator:
Accuracy per position (%) = (Positions counted without discrepancy ÷ Total positions counted) × 100
It is also important to measure quantitative and financial differences:
Absolute discrepancy = |Physical quantity − System quantity|
Estimated financial impact = Absolute discrepancy × Unit cost
These metrics are complementary. A position may show a small unit discrepancy but represent a significant financial impact.
What influences accuracy?
Among the operational causes that need to be investigated are:
Receiving: discrepancies in checking, early postings, or differences between invoice and goods received.
Storage and picking: products stored in incorrect locations, unconfirmed movements, and picks recorded out of sequence.
Master data: inconsistencies between units, boxes, bundles, and conversion factors.
Cycle counting: insufficient counting frequency or methodology inadequate for product behavior.
Addressing: similar products stored close together, increasing the risk of mistaken movements.
From discrepancy to investigation
Imagine that the same aisle shows recurring discrepancies.
Performing a new count may correct the balance momentarily. But if the cause lies in the picking process or addressing, the discrepancy will likely return.
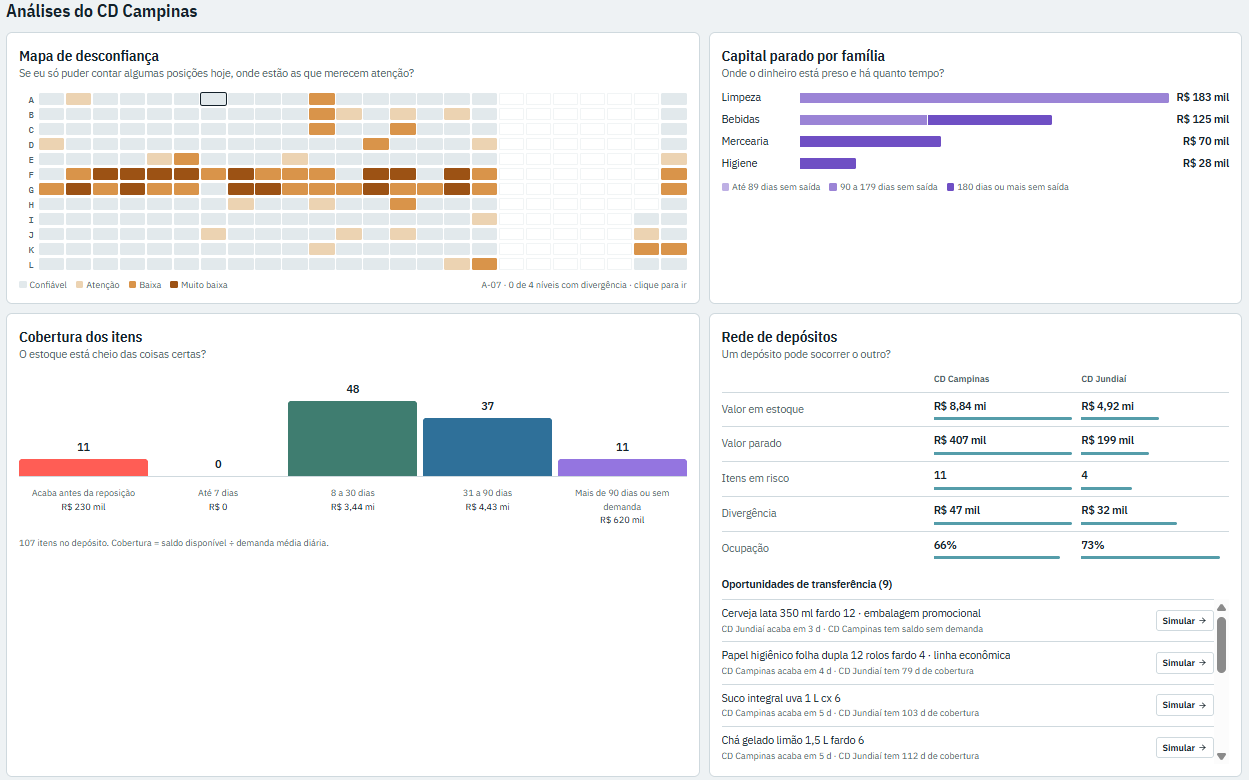
Therefore, an analytical application should allow analysis of recurrence by aisle, location, family, product, and period.
Counting identifies the difference. Data analysis helps identify where to investigate its origin.
This distinction is fundamental to reduce rework and increase the reliability of indicators.
Demand forecasting: why looking only at the past is not enough?
Demand forecasting directly influences purchase volume, safety stock levels, coverage, and the risk of stockouts.
A simple method consists of calculating the average daily demand over the last 28 days:
Average daily demand = Quantity consumed in the last 28 days ÷ 28
From this, we can estimate coverage:
Estimated coverage (days) = Available stock ÷ Average daily demand
These calculations are useful as an initial reference. However, they have important limitations.
Seasonality and promotional periods
During periods such as Black Friday and Christmas, certain products may experience significant changes in demand.
If the projection uses only the recent historical average, there is a risk of underestimating future consumption.
The problem also occurs in the opposite direction.
A promotional campaign may temporarily increase sales. If this behavior is treated as recurring demand, the company may purchase more than it needs.
Slow-moving products
Items classified as curve C often show intermittent consumption.
A product may go several days without any movement and concentrate transactions on specific dates.
In these scenarios, forecasting methods aimed at intermittent demand, such as Croston and SBA, can be evaluated, as well as statistical and machine learning models.
The choice depends on the history, data quality, and behavior of each item.
The role of artificial intelligence
AI models can incorporate different variables:
- Sales and consumption history.
- Seasonality and commercial calendar.
- Promotional campaigns.
- Trends by region and unit.
- Behavior by category.
- History of stockouts and unavailability.
However, forecasting should not be treated as certainty.
An adequate architecture needs to preserve the history of projections, compare forecast and actual demand, and continuously monitor model errors.
It is not enough to project consumption. It is necessary to measure whether the forecast remains reliable to guide decisions.
Stockout: the risk starts before the balance reaches zero
Stockout represents one of the most sensitive problems in the supply chain.
When a product is no longer available, the company may face lost sales, delays, substitutions, emergency purchases, and deterioration of service levels.
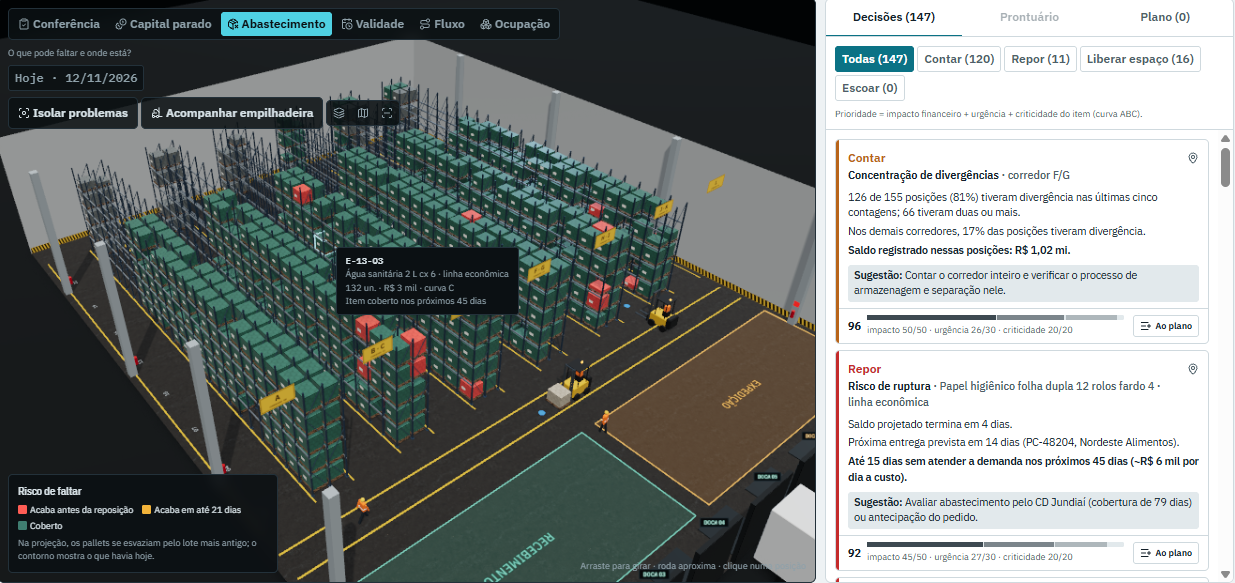
Preventive management needs to analyze the relationship between demand, coverage, lead time, and safety stock.
How to identify the risk
An initial rule can compare the estimated coverage with the expected replenishment lead time:
Risk of stockout when:
Projected coverage is less than the replenishment lead time
Imagine a product with an estimated coverage of five days, while the supplier needs twelve days to deliver.
Without an alternative action, there is a risk of unavailability before receipt.
However, a more complete operational analysis needs to consider confirmed orders, reserved stock, scheduled receipts, projected demand, and historical delays.
The reorder point
A simplified formula is:
Reorder point = (Average daily demand × Lead time) + Safety stock
The safety stock should be sized according to demand variability, supplier reliability, and the desired service level.
This analysis allows the company to move beyond monitoring only the current balance and start observing the future behavior of inventory as well.
Suppliers are also part of the diagnosis
The lead time registered in the ERP does not always correspond to the actual lead time practiced.
Therefore, indicators such as OTIF and actual lead time are important to assess supply reliability.
When the supplier has frequent delays, the replenishment policy needs to take this behavior into account.
Stockouts can be the result of an incorrect forecast, but also of outdated parameters or an unpredictable supply chain.
Idle inventory: the problem is not just occupying space
Excess inventory ties up financial resources that could be available for other business needs.
In addition to the acquisition cost of the products, there are costs associated with storage, handling, insurance, losses, and obsolescence.
In sectors such as food and beverages, the risk increases when products have a limited shelf life.
How to identify immobilized capital
A first analysis consists of relating inventory, cost, and movement.
Inventory value = Available quantity × Unit cost
Days without movement = Reference date − Date of last outbound
Coverage in days = Available inventory ÷ Estimated daily demand
With these indicators, it is possible to identify products with high coverage, prolonged lack of movement, or scheduled receipts incompatible with expected consumption.
An example that changes the decision priority
Consider a distribution center with only 27% occupancy.
In this case, the main problem may not be the lack of physical space.
If there are significant amounts tied up in slow-moving goods, the financial priority may be to review purchases, adjust replenishment policies, and evaluate commercial alternatives.
Freeing up space can bring operational benefits. But the impact on working capital should be analyzed separately.
This distinction is important because physical occupancy and financial efficiency are not the same indicator.
What can a smart solution recommend?
Based on criteria defined with the company, the application can support the evaluation of alternatives such as:
- Suspending or reviewing replenishment orders.
- Evaluating the cancellation of orders not yet shipped.
- Transferring products to units with demand.
- Commercially prioritizing slow-moving items.
- Reviewing minimum stock parameters.
- Identifying products at risk of expiration.
- Analyzing discontinuation opportunities.
Each recommendation needs to consider commercial, operational, and financial constraints.
The goal is not to automate decisions without control, but to provide information so that those responsible can compare alternatives.
Distribution among DCs: excess in one unit and shortage in another
In operations with multiple distribution centers, isolated analysis of each unit can lead to inefficient decisions.
One DC may be close to a stockout while another maintains availability of the same product.
Without an integrated view of the network, the company may make a new purchase even while holding inventory at another location.
Is transfer always the best solution?
Not necessarily.
A transfer decision should compare:
- Quantity actually available.
- Demand and coverage at both DCs.
- Distance between units.
- Transfer lead time.
- Freight and handling cost.
- Risk of stockout at the origin unit.
- Cost and lead time of alternative purchase.
A simplified rule to support the analysis is:
Estimated net benefit = Cost avoided by the transfer − Total cost of the transfer
The benefit needs to be calculated according to the business reality. It is not enough to consider only the difference between balances.
Scenario simulation
This is the point where an analytical application evolves from a query tool to a decision support instrument.
The manager can compare situations such as:
Scenario A: maintain the purchasing and receiving schedule.
Scenario B: transfer part of the stock from another DC.
Scenario C: review purchase orders and redistribute supply.
For each scenario, the application can estimate impacts on coverage, availability, committed capital, and logistics costs, as long as the necessary variables are integrated.
Identifying an opportunity is important. Understanding whether it is financially worthwhile is what sustains the decision.
Essential indicators for intelligent inventory management
A consistent managerial view needs to connect operation, supply, and financial metrics.
| IndicatorWhat it allows to evaluate | |
| Inventory Record Accuracy (IRA) | Reliability of balances and records |
| Inventory turnover | Speed of product movement |
| Coverage in days | Estimated horizon for meeting demand |
| Stockout risk | Possibility of unavailability before replenishment |
| Tied-up capital | Financial value committed to inventory |
| Supplier OTIF | Fulfillment of contracted lead time and quantity |
| Actual lead time | Effective replenishment time |
| Fill rate | Demand fulfillment with available stock |
| Losses due to expiration and damage | Financial and operational impacts |
| Warehouse occupancy | Utilization of physical capacity |
| Transfer cost | Feasibility of redistribution between units |
These indicators need to share consistent definitions.
For example, the coverage calculation can use different stock concepts: physical, available for sale, or projected.
The choice changes the result and must be documented.
The same applies to ABC classification, which can consider consumption value, billing, movement, or other criteria.
Without standardized rules, two areas may analyze the same product and reach different conclusions.
The technology architecture behind the Inventory X-ray
A solution of this type does not depend only on a well-designed visual dashboard.
It requires an architecture capable of integrating systems, processing information, and providing reliable indicators.
DriveData operates in this process by combining Data Engineering, Power BI, Microsoft Fabric, development, and artificial intelligence, according to the needs of each project.
Layer 1. Data integration
The first step is to connect the sources that represent the operation.
Among them:
ERP: purchase orders, suppliers, costs, invoices, registrations, and commercial information.
WMS: positions, addressing, movements, physical balances, inventories, and picking events.
Commercial systems: sales, orders, promotions, and demand forecasts.
Transportation systems: movements between units, lead times, and logistics costs.
Complementary sources: promotional calendars, replenishment parameters, and business rules.
Integration can occur via APIs, connectors, databases, or scheduled loads.
The update frequency needs to match the criticality of the operation.
A dashboard updated daily may suit certain strategic analyses. A high-turnover operation, however, may require more frequent updates for supply decisions.
Layer 2. Engineering and processing
After ingestion, the data needs to be standardized and validated.
A possible architecture in Microsoft Fabric uses OneLake and the Medallion organization:
Bronze: data received from sources, preserving the original records.
Silver: processed data, with standardized units, deduplication, key validation, and movement reconciliation.
Gold: indicators and consumption structures, such as available stock, coverage, risk of stockout, accuracy, and immobilized capital.
This separation facilitates auditing, traceability, and maintenance of business rules.
It is also important to establish controls over delayed data, inconsistent records, and integration failures.
Layer 3. Analytical model
The analytical layer organizes information for consumption in reports and applications.
In Power BI, a semantic model can relate dimensions such as:
- Product, category, and ABC curve.
- Distribution center and address.
- Supplier.
- Calendar.
- Purchase order.
- Movement.
- Inventory.
Measures and business rules allow for standardized calculation of indicators.
The benefit of this structure is not just in presenting results. It is in ensuring that logistics, purchasing, and finance use consistent concepts.
Layer 4. Intelligence and forecasting
With the data organized, it becomes possible to evaluate more advanced analytical models.
Among the potential applications:
Demand forecasting: estimate consumption considering history, seasonality, and commercial variables.
Anomaly detection: identify recurring discrepancies, unusual movements, or unexpected changes in behavior.
Risk classification: prioritize products with a higher probability of stockout or obsolescence.
Simulation: compare alternatives for purchasing, replenishment, and redistribution.
These features depend on sufficient data, model validation, and rules defined with the operation.
Layer 5. Experience and decision-making
The final layer should present information in an interface suitable to the users' needs.
In Power BI, it is possible to create management dashboards for performance analysis, deviation investigation, and indicator monitoring.
For more personalized experiences, corporate applications can be considered that bring together indicators, operational filters, simulations, and decision flows.
One of the technological possibilities under evaluation is Microsoft Fabric Apps, still in preview, which allows exploring data-driven applications within the Fabric ecosystem.
As this is a preview feature, its use in critical processes requires evaluation of availability, support, security, and maturity.
The architecture should not be chosen solely based on the latest technology.
It needs to consider existing systems, the necessary update frequency, user profiles, and the processes that need to be served.
Data governance: the foundation of operational trust
No stock analysis will be reliable if the systems use inconsistent information.
One of the most common examples is the unit of measure.
The purchasing system may record boxes, while the WMS works with units and the commercial area uses packages.
Without correct conversion factors, the discrepancy propagates to coverage, turnover, and availability indicators.
Other critical points include:
Product registration: unique codes, units of measure, families, and commercialization status.
Stock rules: definition of available, reserved, blocked, and in-transit balances.
Lead time: distinction between contractual deadline and actual delivery history.
Purchase orders: updating cancellations, partial deliveries, and expected receipts.
ABC classification: official calculation criteria and update frequency.
Integration quality: verification of incomplete updates, duplicate events, and out-of-sequence movements.
Governance defines the meaning and responsibility for each piece of information.
Data Engineering implements the processes to make it available consistently.
Without data quality, a sophisticated forecast is still built on an unreliable foundation.
How to implement an inventory intelligence solution
Implementation must start from the decisions the company wants to improve, not just from the list of available indicators.
A structured approach can follow five steps.
Step 1. Environment diagnosis
Map ERP, WMS, data sources, replenishment rules, and main operational problems.
It is also necessary to understand which decisions today depend on spreadsheets, manual queries, or validations between areas.
Step 2. Definition of indicators
Standardize concepts of accuracy, coverage, available stock, stockout, turnover, and immobilized capital.
In this stage, those responsible, calculation criteria, and alert rules are defined.
Step 3. Integration and structuring
Build pipelines, process registrations and transactions, validate reconciliations, and make the analytical layer available.
The goal is to establish a reliable base before moving on to predictive models.
Step 4. Development of analyses
Build management and operational dashboards with the ability to drill down by DC, product, supplier, address, and period.
As data maturity increases, incorporate forecasting, risk identification, and simulations.
Step 5. Validation and evolution
Validate the analyses with those responsible for the operation.
Monitor whether the recommendations are aligned with the real constraints of supply, transportation, and purchasing.
The solution needs to evolve according to processes, products, and demand behavior.
How DriveData can help your company
Inventory management involves much more than just tracking balances.
It requires integration between departments, data quality, operational visibility, and the ability to anticipate scenarios.
At DriveData, we develop customized data and technology solutions for companies that need to make their operations more efficient and their decisions better informed.
As a Microsoft Partner, we work with:
Data engineering and integration
We connect different sources and structure data architectures to reduce information fragmentation.
Power BI and management analytics
We develop dashboards and analytical models that help managers track indicators and investigate deviations.
Microsoft Fabric
We assess and implement integration, processing, storage, and analysis architectures according to the complexity of the environment.
Artificial Intelligence and predictive analytics
We explore forecasting models, risk classification, and pattern identification to support operational decisions.
Development and automation
We create customized experiences and integrations to bring information closer to business processes.
The goal is not to indiscriminately replace ERP or WMS.
It is to connect existing data and develop an intelligence layer that helps the company use it better.
From data to decision. From decision to action.
Efficient inventory management needs to answer much more than just how much is stored.
It needs to explain where the risks are, why certain products are idle, which purchases deserve review, and which alternatives may be more advantageous.
Technology allows these pieces of information to be consolidated.
Analytical intelligence helps identify patterns and compare scenarios.
But it is the connection with business processes that makes information useful.
Your company knows how much it has in stock. But can it identify in advance where it is losing money and which decisions can prevent further losses?
Talk to DriveData and learn how we can structure a logistics intelligence solution tailored to the reality of your operation.
Discover our solutions: https://www.drivedata.com.br