
Your delivery will be delayed. Can your operation find this out before the customer does?
How DriveData combined Microsoft Fabric, Rayfin, NASA satellite images, weather intelligence, and live traffic to enhance anticipation capabilities in logistics.
By Tamires Cavani 11/11/2026
A company may have excellent logistics planning, integrated systems, contracted carriers, and well-structured KPIs. Even so, a delivery can be delayed.
An accident blocks the highway. A storm moves into a certain region. Traffic congestion increases unexpectedly. The estimated arrival time no longer matches reality.
And often, the operation only discovers there is a problem when the deadline has already been compromised.
The biggest challenge in logistics is not just knowing where a delivery is. It is understanding what is happening around it and how these conditions can impact the outcome.
This change in perspective represents an important opportunity for companies that want to turn data into real anticipation capability.
The operation does not happen only within the company's systems
ERPs, TMS, WMS, and tracking platforms concentrate essential information for logistics management. But there is a difference between knowing the status of a delivery and understanding the conditions that may compromise its execution.
Planning considers a certain route, distance, and delivery window. However, reality constantly changes. Weather conditions, traffic flow, circulation restrictions, and geographical characteristics directly influence operational performance.
- Delays and missed delivery windows.
- Increased travel time.
- Rescheduling and the need for redeliveries.
- Greater exposure to additional transportation costs.
- Reduced fleet productivity.
- Customer dissatisfaction and compromised SLAs.
The problem intensifies when these events are identified only after their effects have already impacted the operation.
A decision made in advance can cost much less than an incident managed after a delay.
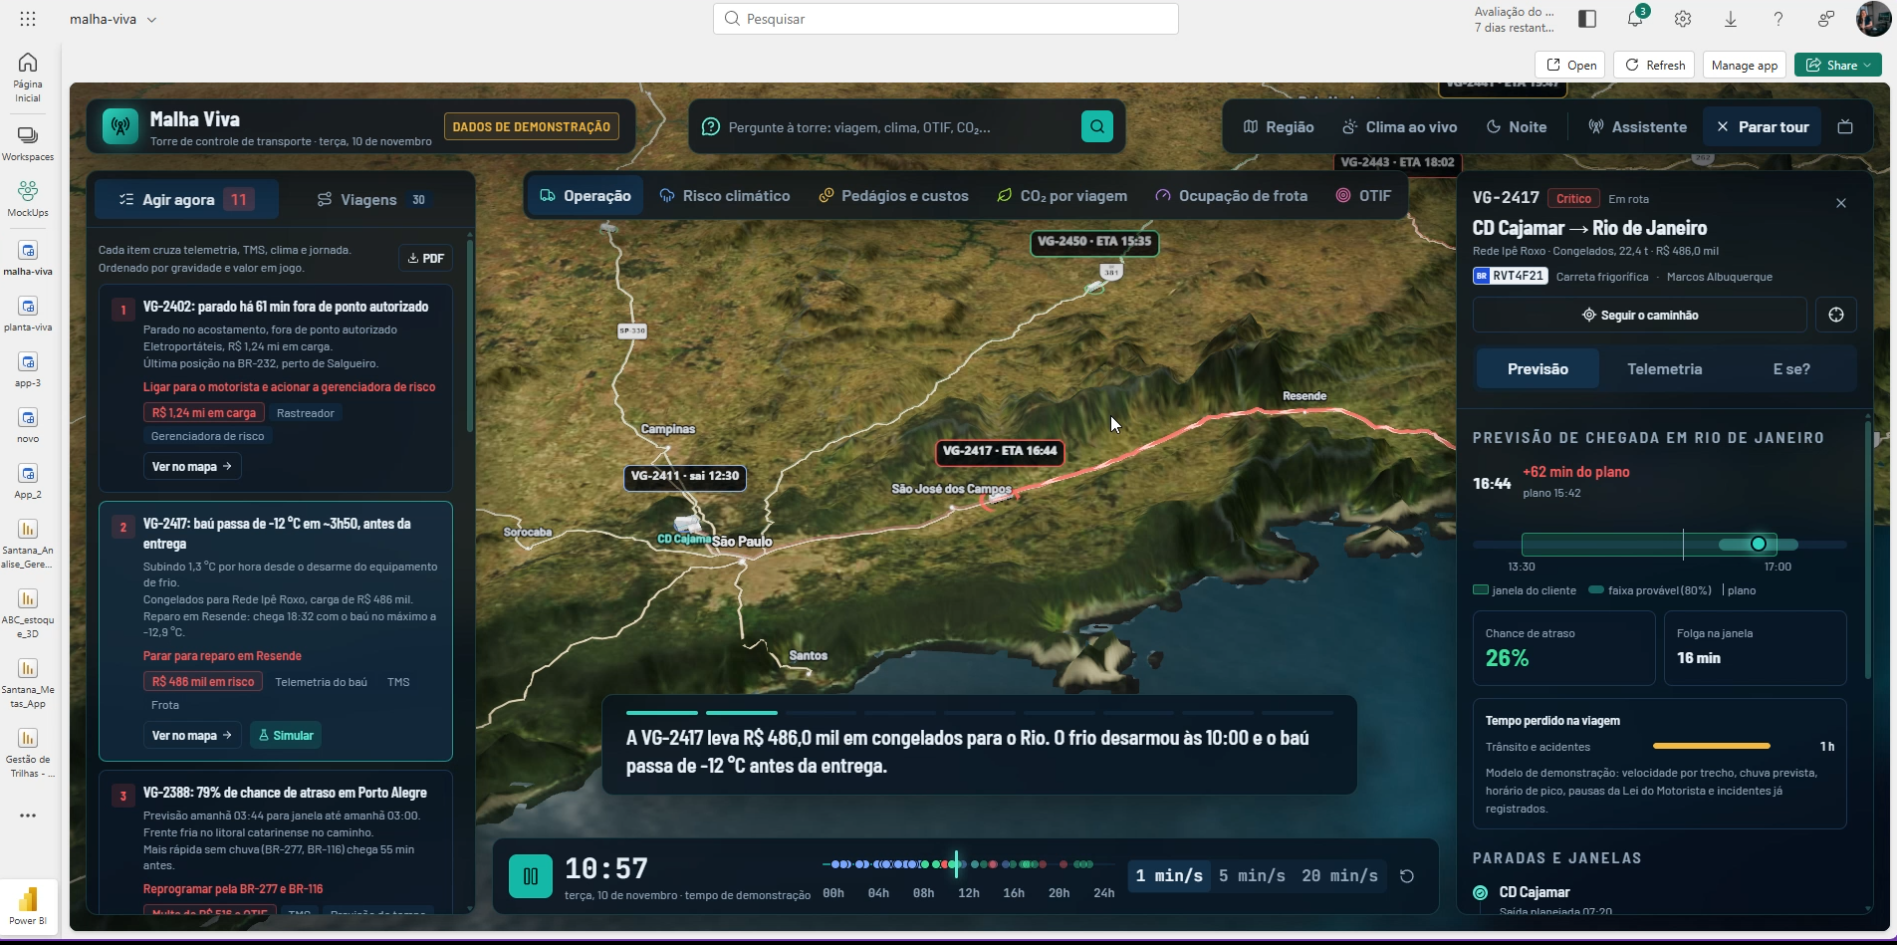
Logistics intelligence: when traffic, weather, and operations start to talk
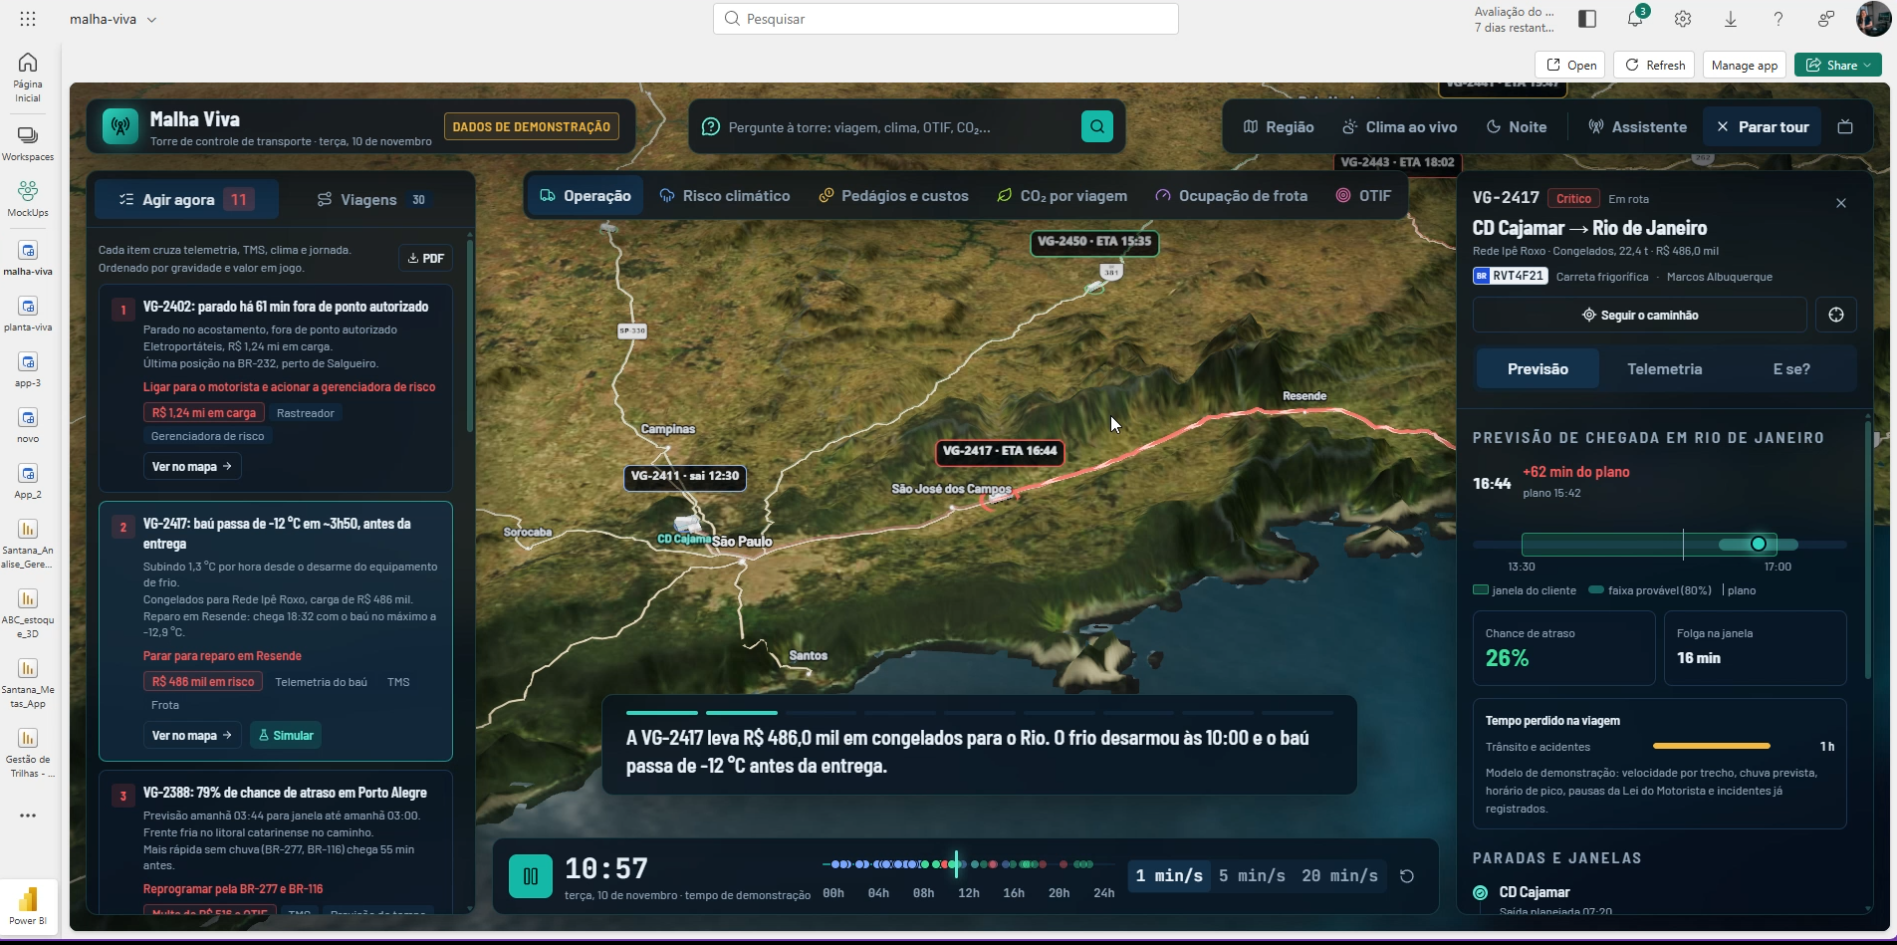
Imagine tracking hundreds of deliveries and being able to see not only the location of each vehicle, but also the traffic, cloud behavior, rain forecast, wind gusts, and the geographical conditions of the routes.
Now imagine using this information to recalculate arrival forecasts and identify which deliveries require attention.
It was with this vision that DriveData developed a logistics intelligence application using Rayfin and Microsoft Fabric, integrating different external services to enrich the operational context.
The project uses four complementary technological sources, with live queries.
1. NASA GIBS and GOES-East satellite: seeing atmospheric conditions
The first integration uses NASA's geospatial infrastructure, through the GIBS (Global Imagery Browse Services) service, with meteorological images from the GOES-East satellite, infrared channel 13.
This channel allows the observation of cloud patterns and cloud brightness temperatures, including at night, supporting the monitoring of the evolution of meteorological systems.
| Technology | Information used | Query in the application |
| NASA GIBS / GOES-East | Infrared images of clouds and atmospheric conditions | Every 10 minutes |
| Open-Meteo Forecast | Rain, temperature, wind, and gust forecasts | Every 30 minutes |
| TomTom Routing | Routes, travel times, and traffic delays | Every 15 minutes |
| AWS Terrain Tiles | Terrain elevation and geographical visualization | On demand, as the camera zooms in |
In the application, the image query occurs in cycles of approximately 10 minutes, according to the configuration set for the project. The result is a visual layer that allows monitoring of atmospheric behavior in the regions of operational interest.
This helps to contextualize potentially adverse conditions, although an isolated infrared image alone does not determine the intensity of rain or the existence of a roadblock.
The value for logistics: to expand the situational awareness of teams and allow the evolution of weather conditions to be considered before the operational impact occurs.
2. Open-Meteo Forecast API: turning weather forecast into delivery intelligence
The second integration uses the Open-Meteo Forecast API. While satellite images help visualize atmospheric conditions, Open-Meteo provides forecasted meteorological variables for specific geographical coordinates.
- Precipitation and probability of rain.
- Temperature and weather conditions.
- Wind speed and gusts.
- Hourly distributed forecasts.
- Useful information for risk assessment along routes.
In the project architecture, queries are performed approximately every 30 minutes. These data can be cross-referenced with the itinerary, scheduled times, and the estimated arrival of deliveries.
A route that shows normal conditions at the time of departure may cross a region with heavy rain forecast a few hours later. By incorporating this variable into risk calculation and ETA (Estimated Time of Arrival) analysis, the operation gains the ability to proactively assess possible impacts.
It is important to differentiate the application's query frequency from the update frequency of meteorological models, which varies according to the source used.
The value for logistics: turning weather forecast into a planning variable, not just information consulted after a problem has already occurred.
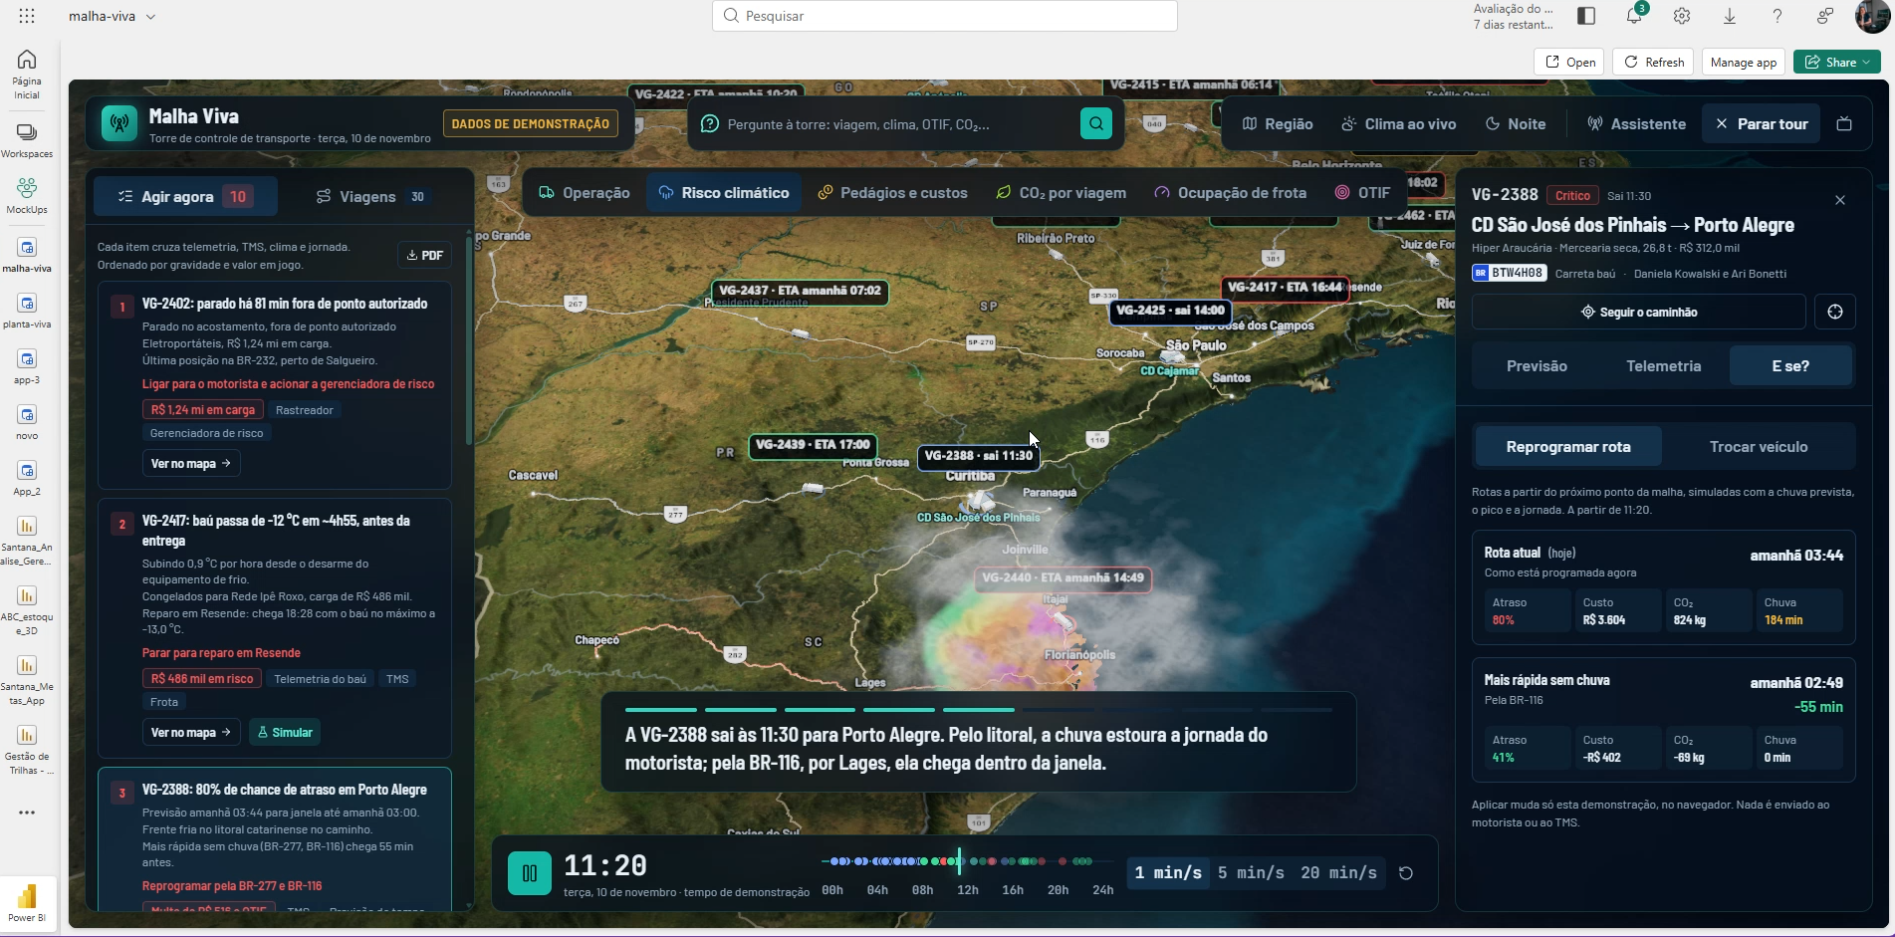
3. TomTom Routing API: routes and arrival forecasts considering traffic
The third integration uses the TomTom Routing API, with traffic information and specific configuration for cargo vehicles. The technology allows routes to be calculated taking traffic conditions into account and, according to the parameters used, truck characteristics and circulation restrictions.
In the application, queries occur approximately every 15 minutes. The API provides information that may include:
- Estimated travel time.
- Delays related to traffic.
- Route distance and geometry.
- Sections affected by traffic jams.
- Assessment of alternative routes.
- Conditions and restrictions relevant to trucks.
With this data, the ETA is no longer dependent solely on a fixed travel estimate. If congestion increases significantly, the arrival forecast can be recalculated and compared with the customer's receiving window.
Another differential is in the technical architecture: the call to TomTom is made by a backend function in the Microsoft Fabric application environment, keeping the access key protected on the server, without exposing it in the application interface.
This approach combines operational integration and good security practices.
The value for logistics: anticipating delay risks, improving delivery predictability, and supporting routing decisions with data closer to the actual road conditions.
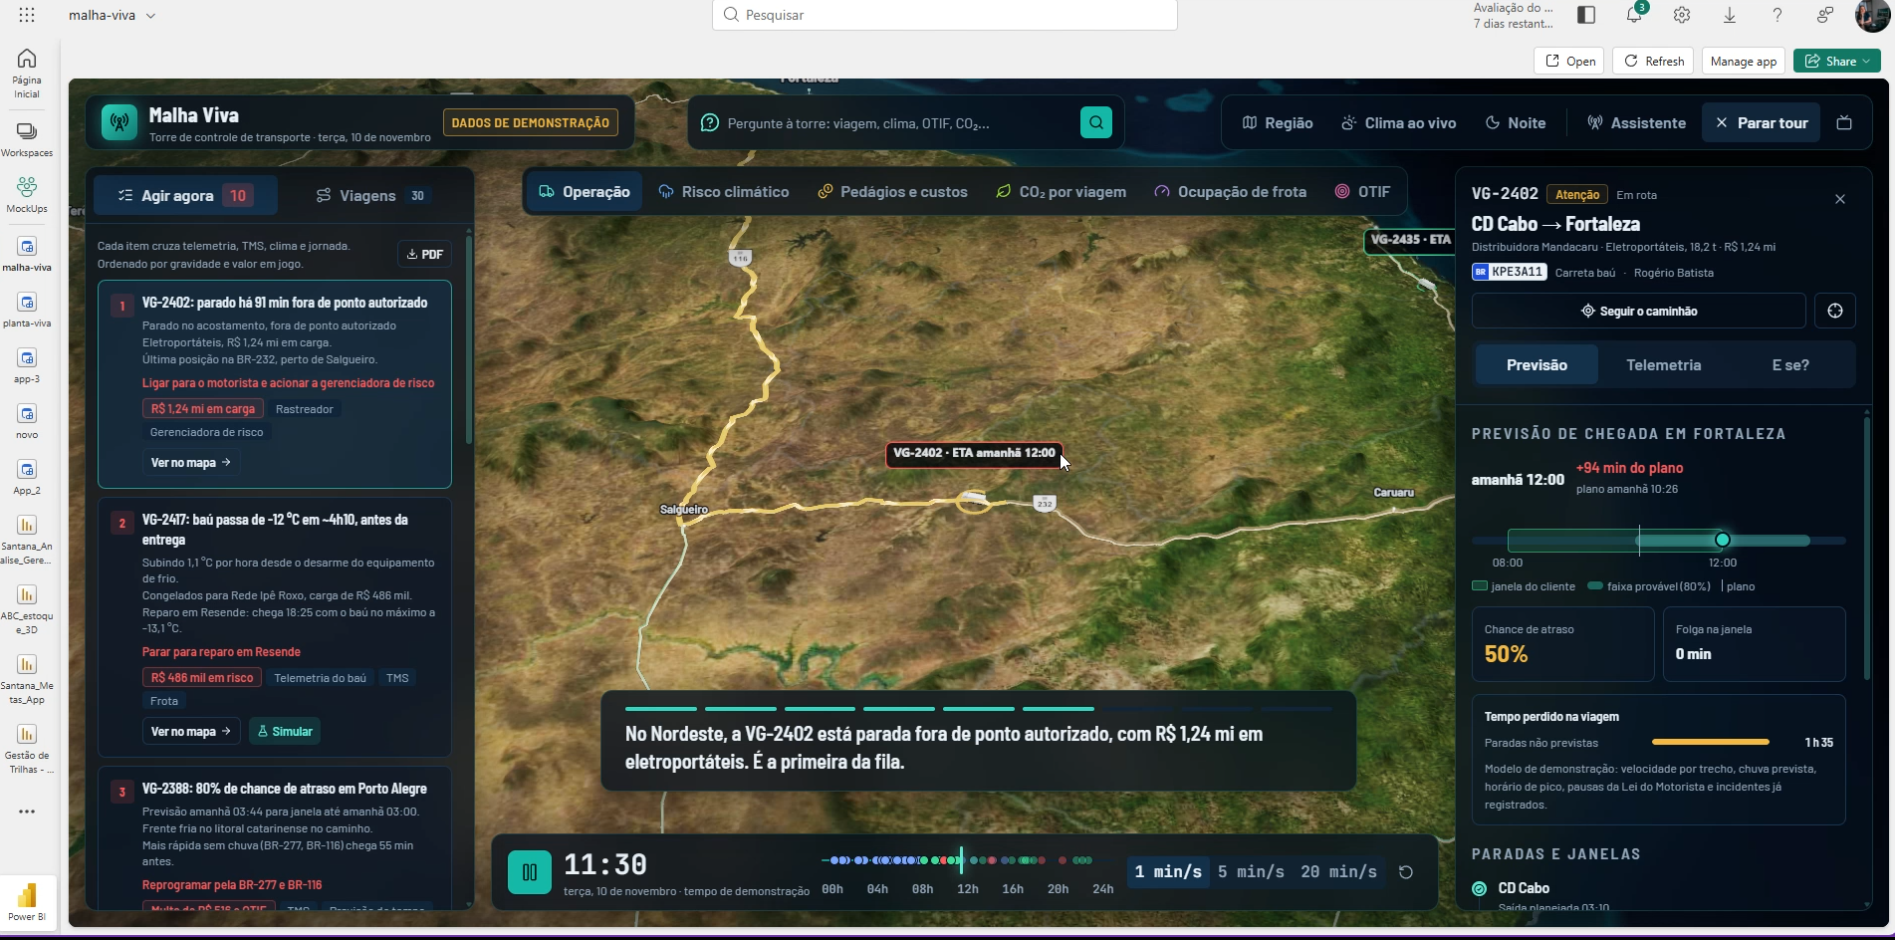
4. AWS Terrain Tiles: a geographical dimension for the operation
The fourth integration uses AWS Terrain Tiles elevation data, in Terrarium format. Unlike weather and traffic sources, this integration works with geographical terrain information.
In the application, elevation data is loaded as the camera zooms in on the represented areas, allowing the terrain to be viewed in greater detail.
This layer offers a three-dimensional representation of the geographical environment, contextualizing highways, mountainous regions, valleys, and terrain features.
Relief can be especially relevant for route analysis and transport planning, although its direct contribution to estimates of consumption, speed, or restrictions depends on additional rules and models.
The value for logistics: adding geographical context and a more complete visual experience to operational analysis, especially in regions with relevant topographical features.
Four integrations, one connected operational view
The main differential is not in using a traffic API, another for weather, or a satellite layer in isolation. It is in the possibility of combining this information with the company's data.
These frequencies represent the informed query strategy for the application, not a guarantee that all sources will publish new data at these same intervals.
The potential emerges when these layers are connected to orders, deliveries, vehicles, and the operational rules of each company.
The same route may have its estimated arrival compromised by a traffic jam, cross a region with forecasted heavy rain, and require additional attention in certain sections. Instead of analyzing each variable separately, the manager now has an integrated context to decide where to act first.
Why do Microsoft Fabric and Rayfin make a difference?
A solution like this requires more than a dashboard with maps. It is necessary to connect external services, process data, structure business rules, provide functionalities to users, and preserve the security of integrations.
Microsoft Fabric offers an ecosystem for data engineering, analytics, storage, processing, and real-time intelligence. Rayfin expands the possibilities for application development in this environment, allowing the construction of corporate interfaces and functionalities on top of the Fabric infrastructure.
- Development of corporate applications with custom interfaces.
- Integration with APIs and external systems.
- Execution of functions on the server.
- Protection of keys and secrets used in integrations.
- Connection with data and services from the Microsoft ecosystem.
- Use of corporate identity and governance resources.
- Possibility of evolution with automations, advanced analytics, and artificial intelligence.
In the application developed by DriveData, this architecture allows the gathering of operational and geographical information in a connected experience. The result is a solution that goes beyond traditional indicator visualization and opens the door to monitoring processes, risk analysis, and preventive action.
And there is another strategic advantage: the company can evolve these functionalities without necessarily replacing its current ERP, TMS, or WMS systems.
What changes when the company can anticipate?
Consider an illustrative scenario. A carrier has 200 deliveries scheduled for the day. A vehicle is on its way to a customer who only receives goods until 4 p.m.
The original plan foresees arrival at 3:20 p.m. Along the way, TomTom identifies a 35-minute increase in travel time. At the same time, weather data points to the possibility of heavy rain in the destination region.
The new ETA approaches the receiving window limit. In a reactive operation, the company may only discover the risk when the driver reports the delay.
In an operation with integrated intelligence, this combination of information can feed a risk rule and draw the team's attention in advance. From there, the person responsible is able to evaluate alternatives: reorganize the route, inform the customer, negotiate the receiving window, or proactively reschedule the operation.
Technology does not eliminate the unexpected. It increases the possibility of acting before the unexpected turns into a loss.
Which indicators can be impacted?
| Indicator | How it can be impacted |
| OTIF — On Time In Full | Anticipation of deliveries at risk of missing deadlines and quantities |
| OTD — On Time Delivery | Preventive identification of possible delays |
| ETA accuracy | Estimates better adjusted to traffic conditions |
| Delivery SLA | Early monitoring of risk of non-compliance |
| Cost per delivery | Support for reducing reschedulings and unproductive trips |
| Redelivery rate | Opportunity for rescheduling before failed attempts |
| Fleet productivity | Better understanding of time losses in transit |
| Average transit time | Comparison between planned and actual routes |
| Deliveries at risk | Identification and prioritization of operations with greater exposure |
| Lead time | Measurement of how many minutes or hours in advance a risk was identified |
The integration between operations, traffic, and meteorology creates opportunities for improvement in key logistics indicators.
Two of these indicators deserve special attention:
ETA accuracy: what is the difference between the estimated and actual arrival time?
Risk lead time: how long before a possible SLA violation was the problem identified by the operation?
The first measures predictability. The second helps measure the ability to anticipate. Effective improvement of these indicators should be validated with operational data, comparing performance before and after implementation.
The future of logistics is not about having more information. It's about knowing what to do with it.
For a long time, companies have invested in tools to record movements, track orders, and analyze past performance. These capabilities remain essential.
But the next stage of maturity is to use internal and external information to guide decisions while there is still time to change the outcome.
Traffic, weather, satellite, terrain, and operational information are no longer disconnected sources and become part of a smarter business view. Microsoft Fabric and Rayfin demonstrate how modern applications can bring data, integration, and operational execution closer together.
Smart logistics is not about explaining all the delays. It's about continuously increasing your ability to avoid them.
Is your company ready for this evolution?
At DriveData, we combine consulting, data engineering, Business Intelligence, Microsoft Fabric, artificial intelligence, automation, and application development to turn business challenges into technological solutions.
We support companies that need to integrate their systems, develop control towers, modernize their analytics environments, and create applications tailored to their operational processes.
Our work begins with understanding the business problem: which decisions need to improve, where the bottlenecks are, and which information can generate concrete impact.
And for companies that want to develop skills internally, DriveData Academy offers mentoring, corporate training, and capacity-building programs in data technologies, Power BI, Microsoft Fabric, and artificial intelligence.
Because it's not enough to implement technology. You need to prepare teams to extract value from it.
Want to understand how your operation can connect internal data, weather, traffic, and operational intelligence in a single application?
Discover DriveData's solutions and talk to our specialists.
DriveData — Turning data into decisions that move business.
Learn more: https://drivedata.com.br
Training and mentoring: https://academy.drivedata.com.br