
A financial journey that makes sense for both managers and implementers
A guided journey in Power BI, developed based on the Protheus data dictionary, which connects indicators, simulations, and action plans to bring clarity to financial decision-making.
A company may have its financial processes recorded in the ERP and still face a daily challenge: turning this information into a clear sequence of decisions.
The balance is available. The accounts receivable and payable are too. There are records, transactions, and histories. But, faced with this volume of data, essential questions still require effort:
Where should the analysis start? What deserves attention first? How does one piece of information relate to another? And what action can improve cash flow?
For management, this difficulty translates into time spent interpreting reports and aligning priorities. For the technical team, it appears as recurring requests for new indicators, extractions, and explanations about the origin of the numbers.
The Protheus Financial Journey was developed to bring these two audiences closer together: it combines a technical structure based on ERP data with an analysis experience organized around business questions.
The pain begins when the user has to build the analysis alone
In financial routines, consulting a piece of information does not mean understanding its consequences.
A positive balance may convey peace of mind, while upcoming due dates point to a need for cash. A large receivables portfolio may seem favorable, but part of it is overdue or concentrated in higher-risk clients. A comfortable consolidated position may hide difficulties in a branch.
To reach a decision, the user needs to connect these facts.
When this connection depends on scattered queries, the process tends to be concentrated among the most experienced professionals. They are the ones who know which screens to open, which numbers to compare, and which questions to ask.
The challenge of a financial dashboard, therefore, is also about experience: organizing the reasoning so that the user can move from information to action.
A journey built from management's questions
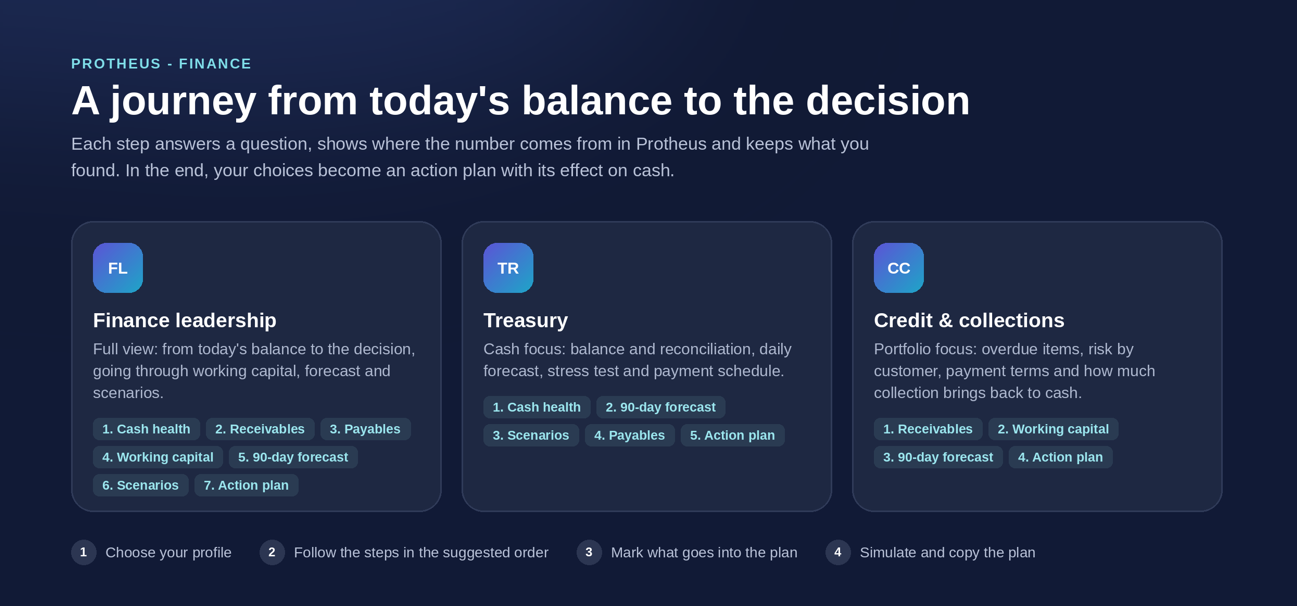
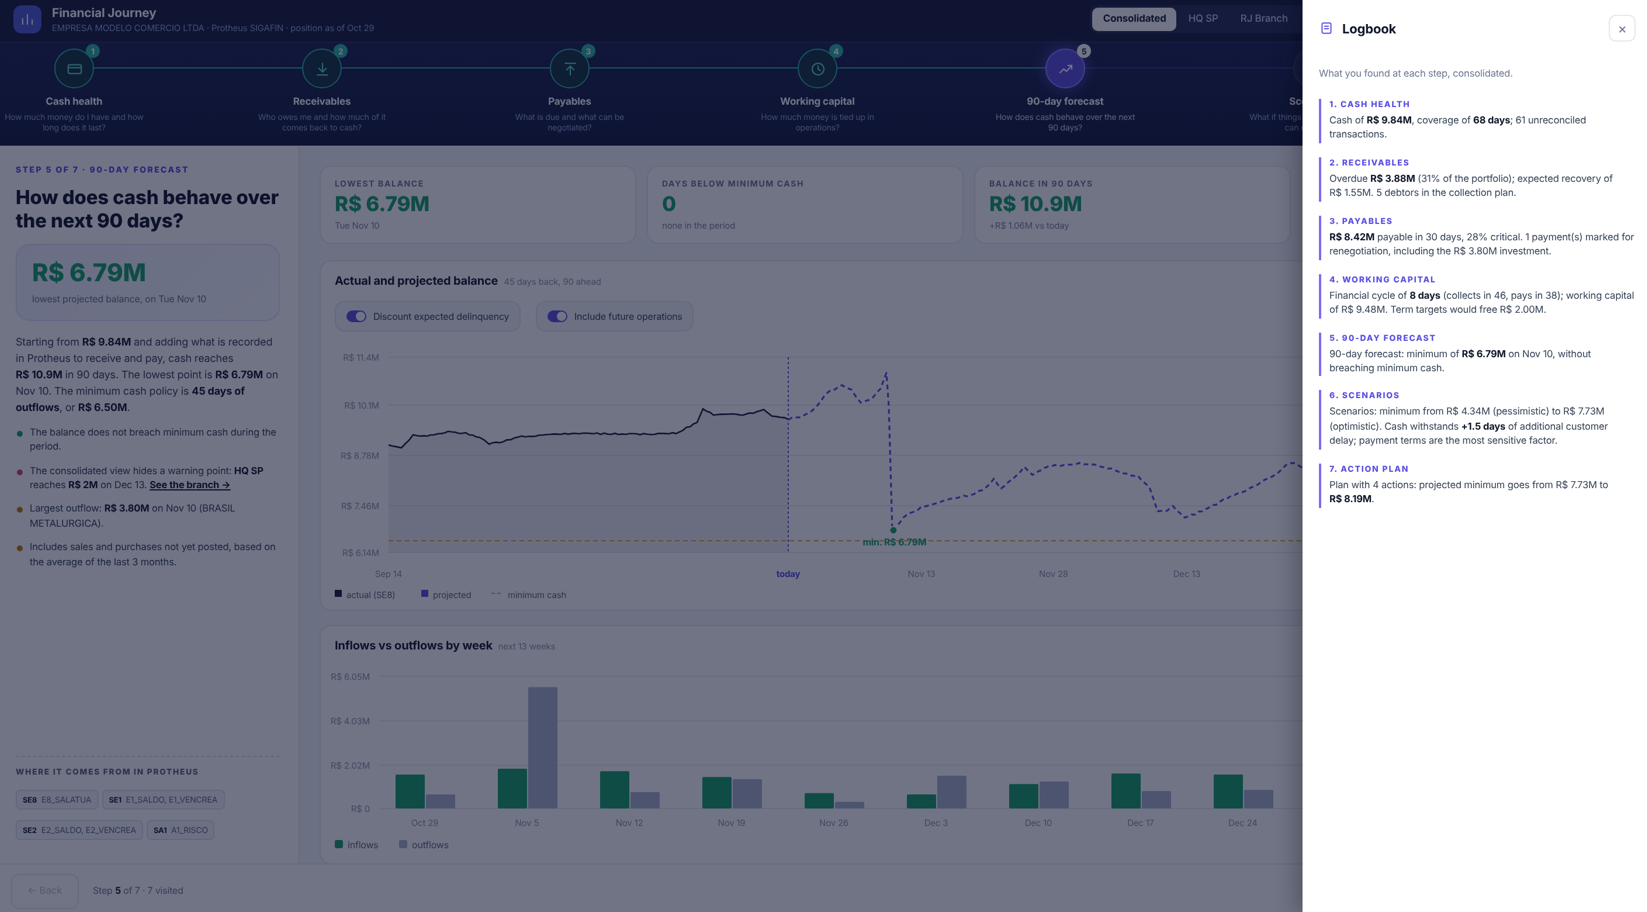
The Financial Journey structures the analysis in seven complementary steps. Each one answers a question and provides context for the next.
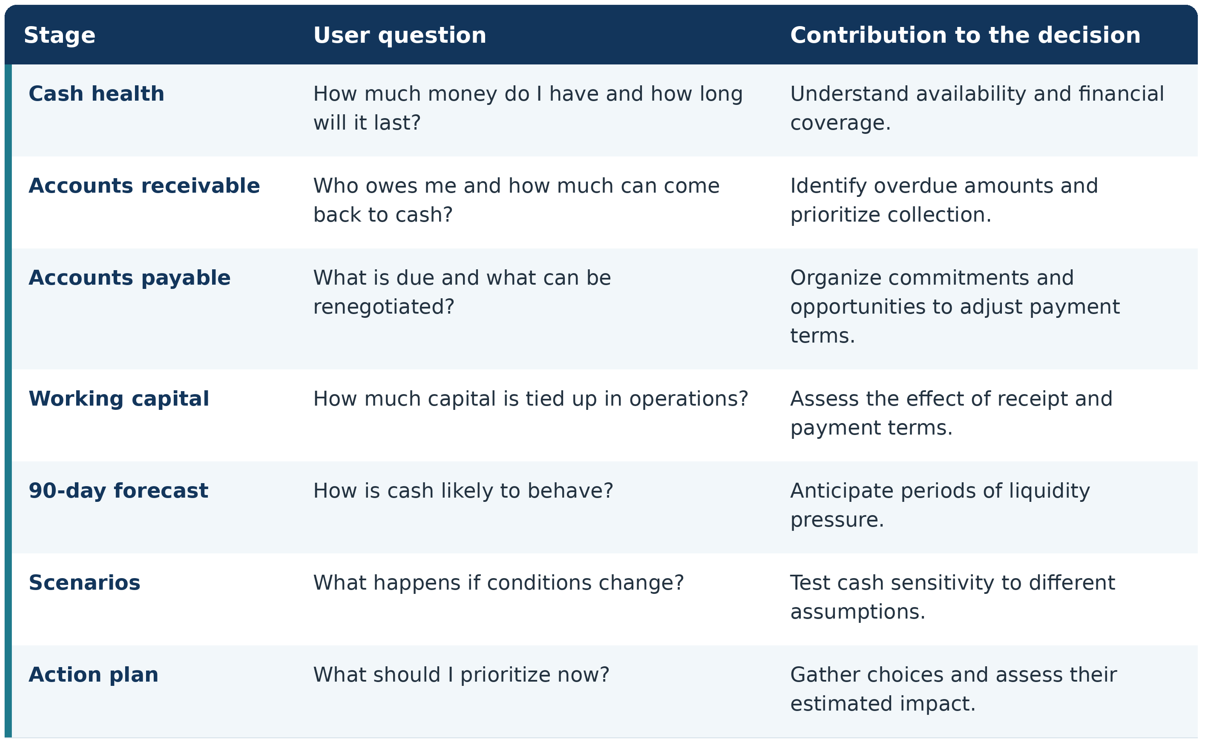
This sequence gives continuity to the experience. When analyzing the portfolio, the user selects clients for collection. When evaluating commitments, they identify payments for renegotiation. These choices move on to the action plan, where they can be simulated.
The analysis now has a clear destination.
An experience suited to each user's responsibility
Financial management, treasury, and credit and collection work with related information, but need to answer different questions.
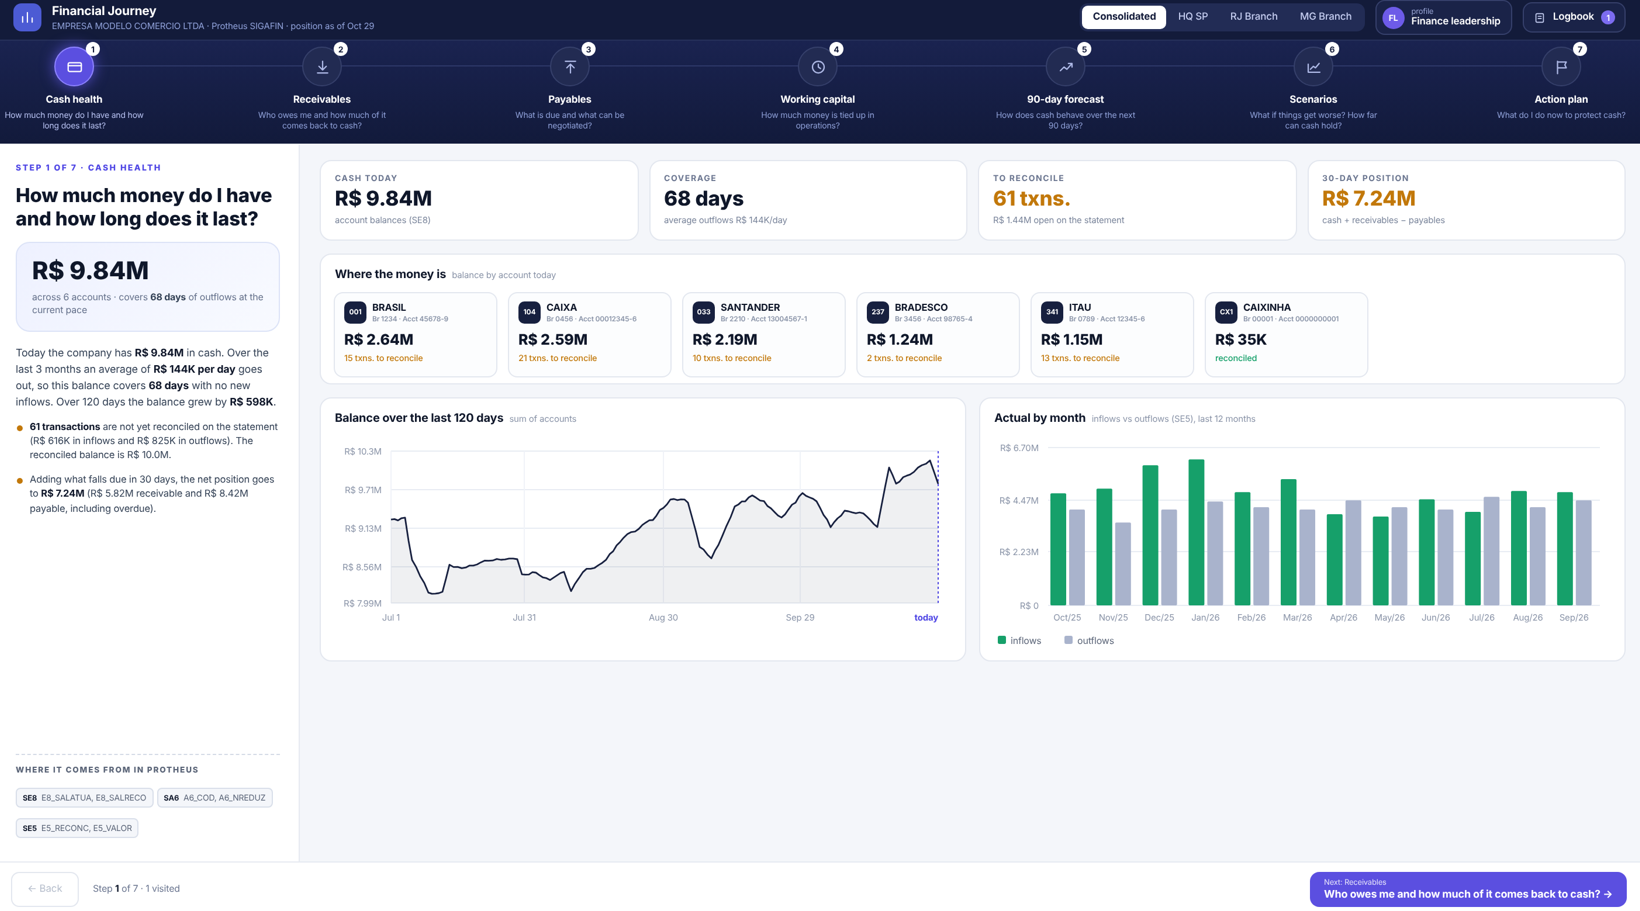
Management needs to understand the financial position, risks, and alternatives. Treasury focuses its attention on availability, due dates, and cash continuity. Credit and collection need to understand the portfolio, client behavior, and recovery priorities.
Therefore, the dashboard presents specific paths by profile, guiding navigation according to each area's responsibility.
The indicators are accompanied by explanations, alerts, and source references. A logbook gathers the main findings along the way, supporting the resumption of analysis and alignment with the team.
For the business, this represents an opportunity to make financial interpretation more accessible and consistent among users.
The technical foundation: Power BI and Protheus data dictionary
The project was developed as a Power BI dashboard, in a plug-and-play format, based on the Protheus data dictionary.
This foundation guides the relationship between operational information and its analytical representation. The goal is to establish an understandable correspondence between ERP records and the indicators presented to the user.
In the demonstration, the source references include structures such as:
- SE1: accounts receivable titles and information.
- SE2: accounts payable titles and information.
- SE5: financial transactions.
- SE8: bank balances.
- SA1 and SA2: client and supplier records.
- SA6 and SED: bank information and financial natures.
The screens also display references to fields used in the analyses. For the technical team, this visibility facilitates discussion about the origin, composition, and validation of the indicators. For management, it helps connect the displayed number to the operation that generated it.
Implementation should align three elements: data source, calculation rule, and business interpretation. A late payment indicator, for example, needs to consider the maturity, settlement, and balance criteria adopted by the company. The classification of a payment as critical must also reflect a rule recognized by the operation.
It is in this alignment that the technical structure gains managerial usefulness.
Plug-and-play with environment validation
The plug-and-play approach offers a structured starting point: journey, indicators, and analysis resources already organized for the financial context of Protheus.
This allows the implementation to focus on connecting to the data and adapting to the company's environment.
To preserve the consistency of the results, this stage should verify aspects such as companies and branches, field completion, registration particularities, customizations, and adopted financial rules.
References to specific or customized fields require special attention. Their availability and meaning need to be checked in the target environment.
Agility comes from a previously structured solution, accompanied by the necessary validation so that the numbers represent the client's operation.
Projections and scenarios make alternatives visible
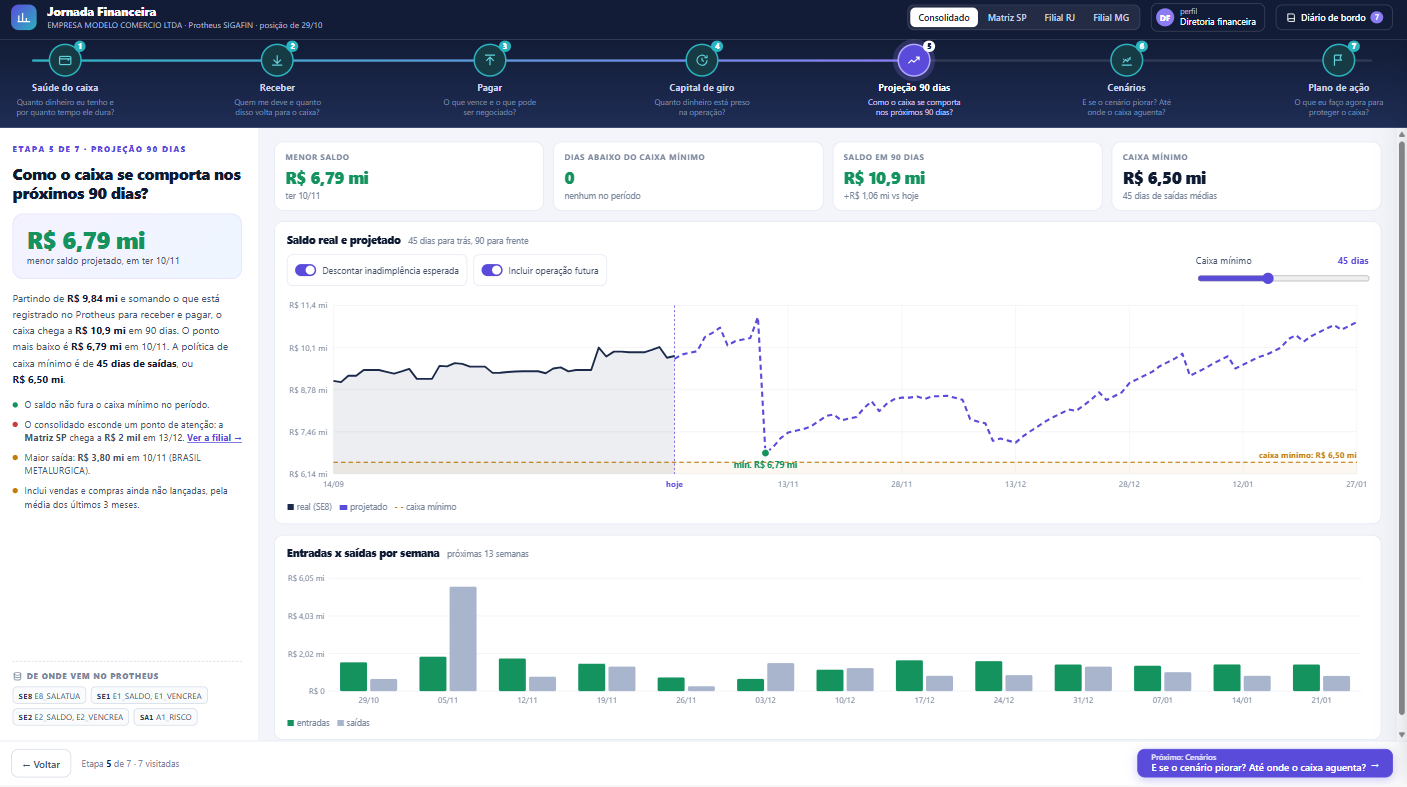
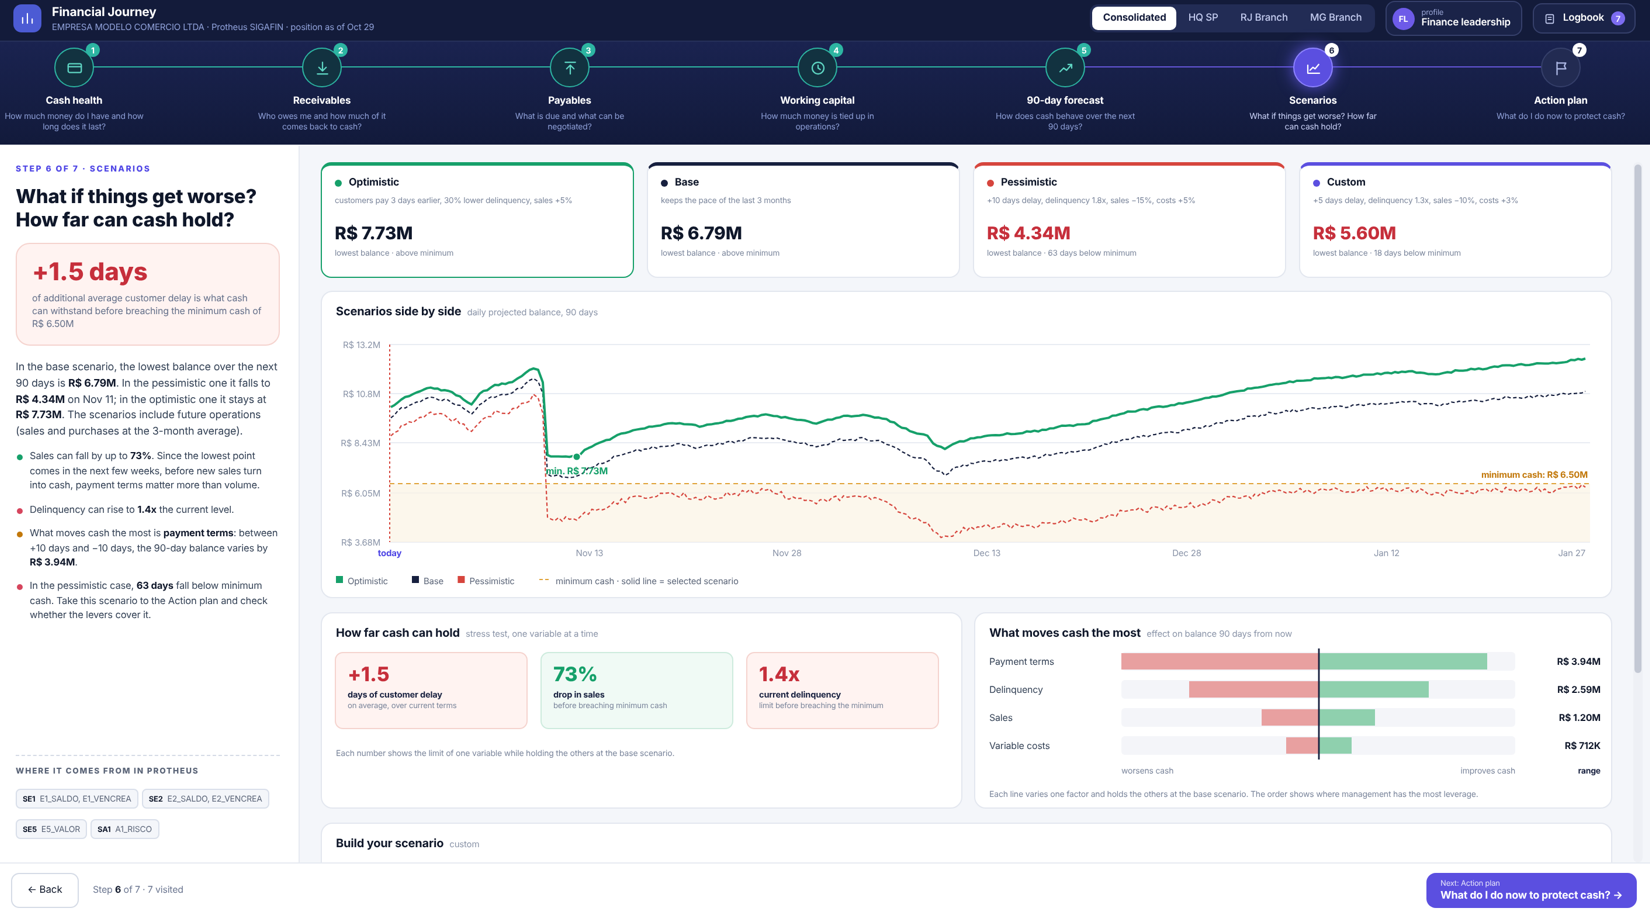
After understanding the current position, the user can evaluate the estimated cash flow behavior for the next 90 days.
The projection highlights the lowest balance, periods below the minimum reserve, and the evolution of inflows and outflows. The experience allows for adjusting assumptions, such as expected default, future operations, and minimum cash policy.
Scenarios broaden this analysis. It is possible to compare optimistic, reference, pessimistic, or customized conditions, observing the effect of changes in collection periods, sales, default, and variable costs.
For management, this helps discuss alternatives with a common financial reference.
For the technical team, it reinforces the importance of keeping assumptions explicit: a projection is a result conditioned by the data and hypotheses used. Its usefulness lies in supporting decision-making and making the estimated consequences more understandable.
From diagnosis to an action plan
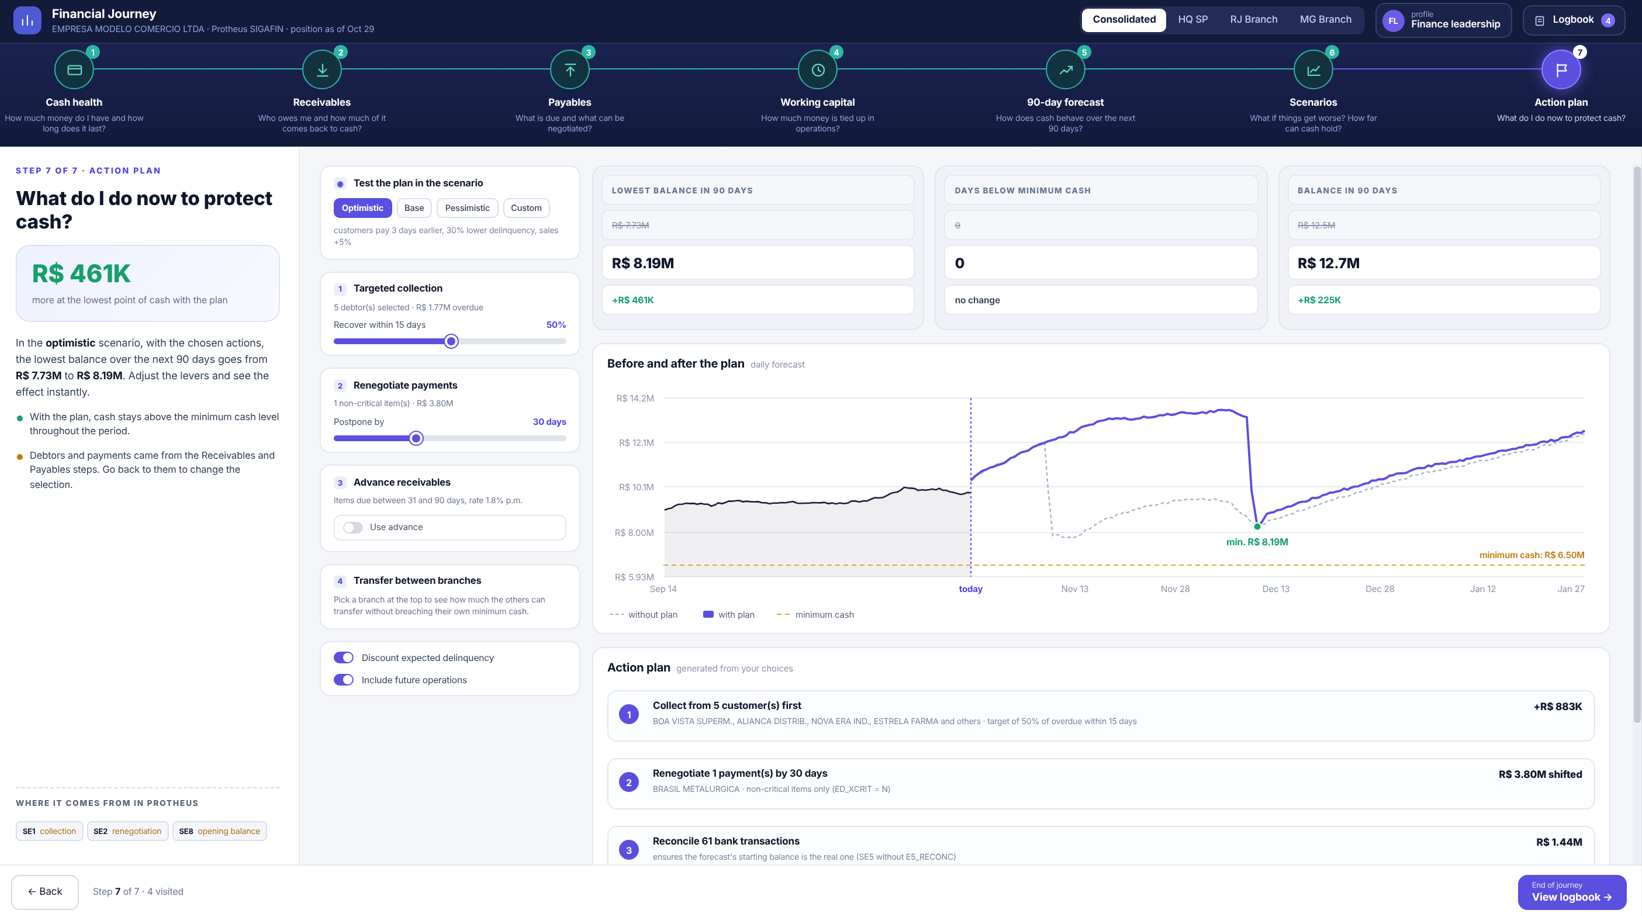
The final stage brings together the choices made during the journey and allows for simulating measures such as:
- Targeted collection from selected clients.
- Renegotiation of eligible payments.
- Anticipation of receivables.
- Transfer of resources between branches, considering the minimum reserves of each unit.
The user compares the projection with and without the plan, observing changes in the lowest balance, final balance, and days below the minimum cash.
The plan also presents relevant operational pending items, such as transactions to reconcile and overdue payments, and can be copied to support the forwarding of actions.
These resources support planning. The execution of collections, renegotiations, and financial movements follows the company's processes and authorizations.
Value for decision-makers and information stewards
For management, the Financial Journey offers an organized path to understand the present, anticipate difficulties, and prioritize actions.
For users, it offers context: what to observe, why it matters, and how to advance in the analysis.
For the technical team, it offers an analytical structure supported by the Protheus data dictionary, with source references that facilitate validation and maintenance.
The result is a common language between business and technology, connecting data, rules, and decisions in a single experience.
Does your team know what the next step is?
The value of financial information appears when people are able to use it.
The Protheus Financial Journey was designed to facilitate this path: starting from today's balance, understanding the factors that influence cash flow, and arriving at a plan with an estimated impact.
Discover the Power BI dashboard and see how a user-oriented journey can transform your company's financial analysis.
Schedule a demonstration to evaluate the application of the solution to your Protheus environment.