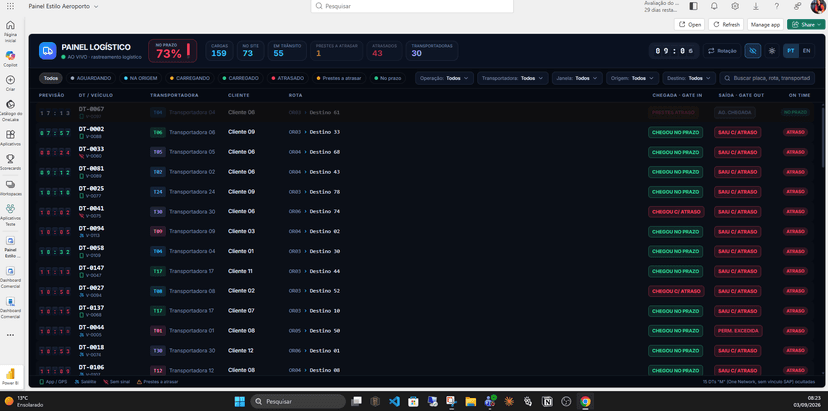
Logística Inteligente
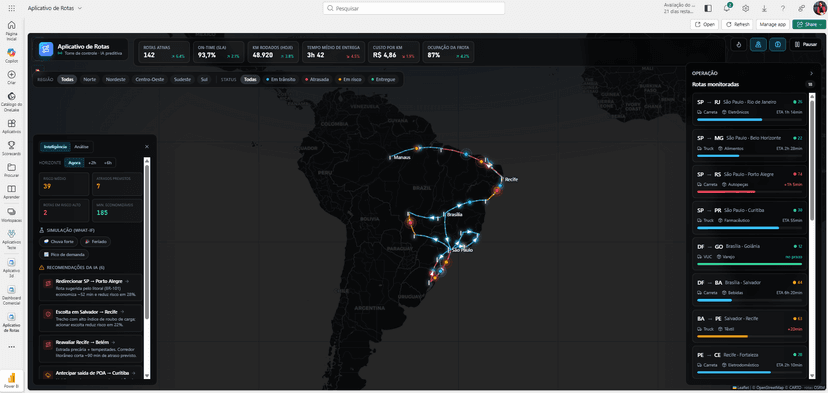
Your shipment is going to be late. The question is: how early will your operation be able to detect it?
In many transportation operations, a delay only becomes visible after it has already happened.

The problem: when numbers do not tell the full story
In an increasingly data-driven business scenario, the financial area is no longer only operational to assume a strategic role within organizations. However, many companies still make critical decisions based on static reports, extensive spreadsheets and little visibility about what is really happening in the business.
It was from this challenge that DriveData developed a Visual Financial Analysis, joining Power BI, DRE, Cash Flow and Budget in a single environment, auditable and intuitive. The result is a new way of seeing the numbers: clear, visual and actionable.
Demonstration of the Outcome of the Year (DRE) is one of the most important reports of financial management. However, in practice, it is usually analyzed in isolation, in PDFs or spreadsheets, making it difficult:
Without visual context and integration between information, the financial responds to problems rather than anticipate them.
Visual data analysis turns complex numbers into understandable information. Using the Microsoft Power BI, DriveData created a Full Financial Dashboard, where DRE is no longer a static report and becomes a living management tool.
In this project, each indicator was designed to answer strategic questions, such as:
All this in an intuitive visual experience, built with prototypation in Figma, use of SVGs, HTML and Advanced DAX, raising the aesthetic and functional pattern of the dashboard.
One of the major differences of the project was the creation of a visual audit of receipts and balances, connected linearly to the cash flow.
In practice, this means that the manager can:
This approach reduces risks, increases transparency and strengthens financial governance.
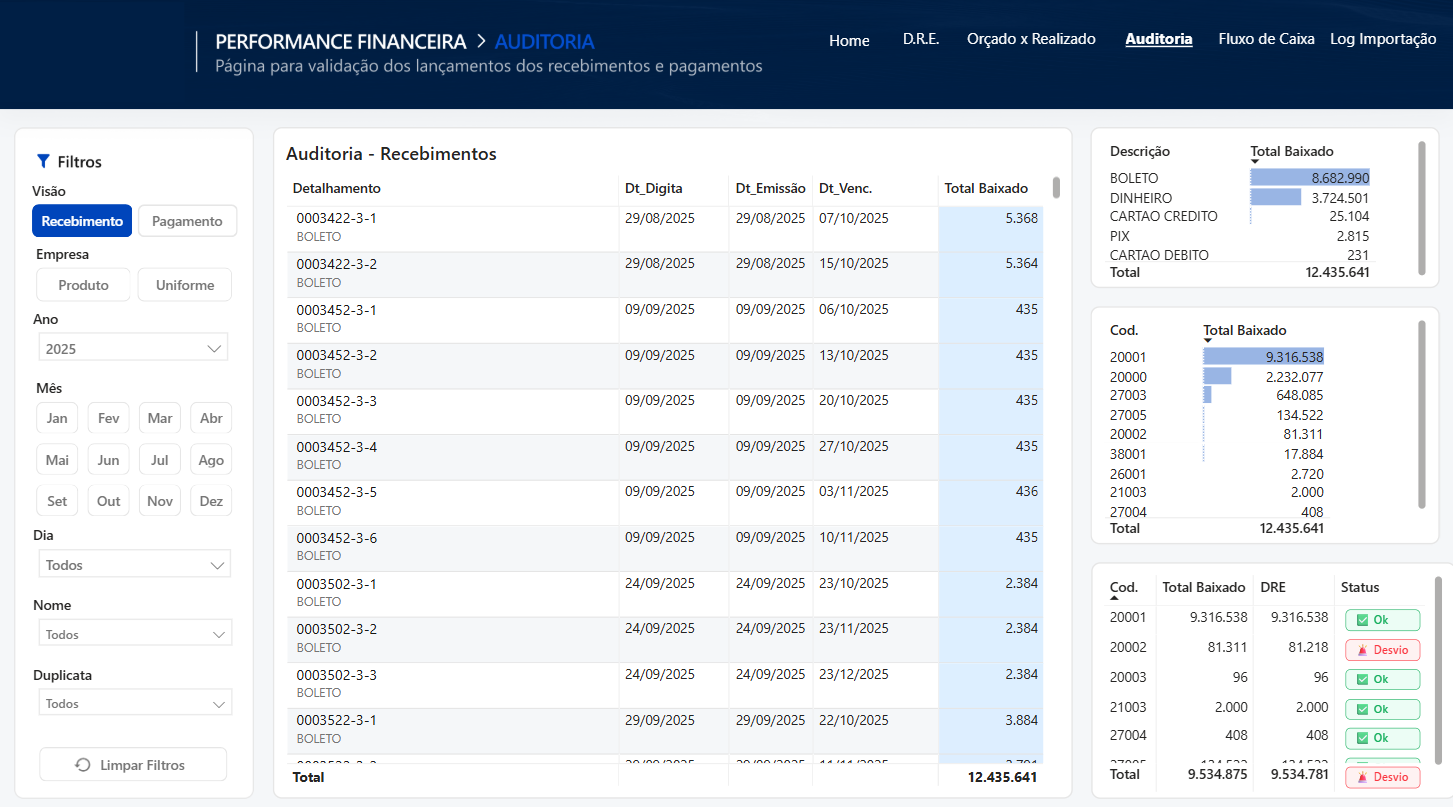
Separately, each report is already important. Integrated, they become strategic.
By connecting these three visions into a single environment, the company starts to see not only the result, but also why the result and the future impact of decisions.
This integrated vision allows you to act in advance, correct routes and sustain business growth.
On DriveData, we believe that BI is not just viewing, it is decision-making.
Each dashboard is built with a focus on:
Design exists to serve strategy — not the other way around.
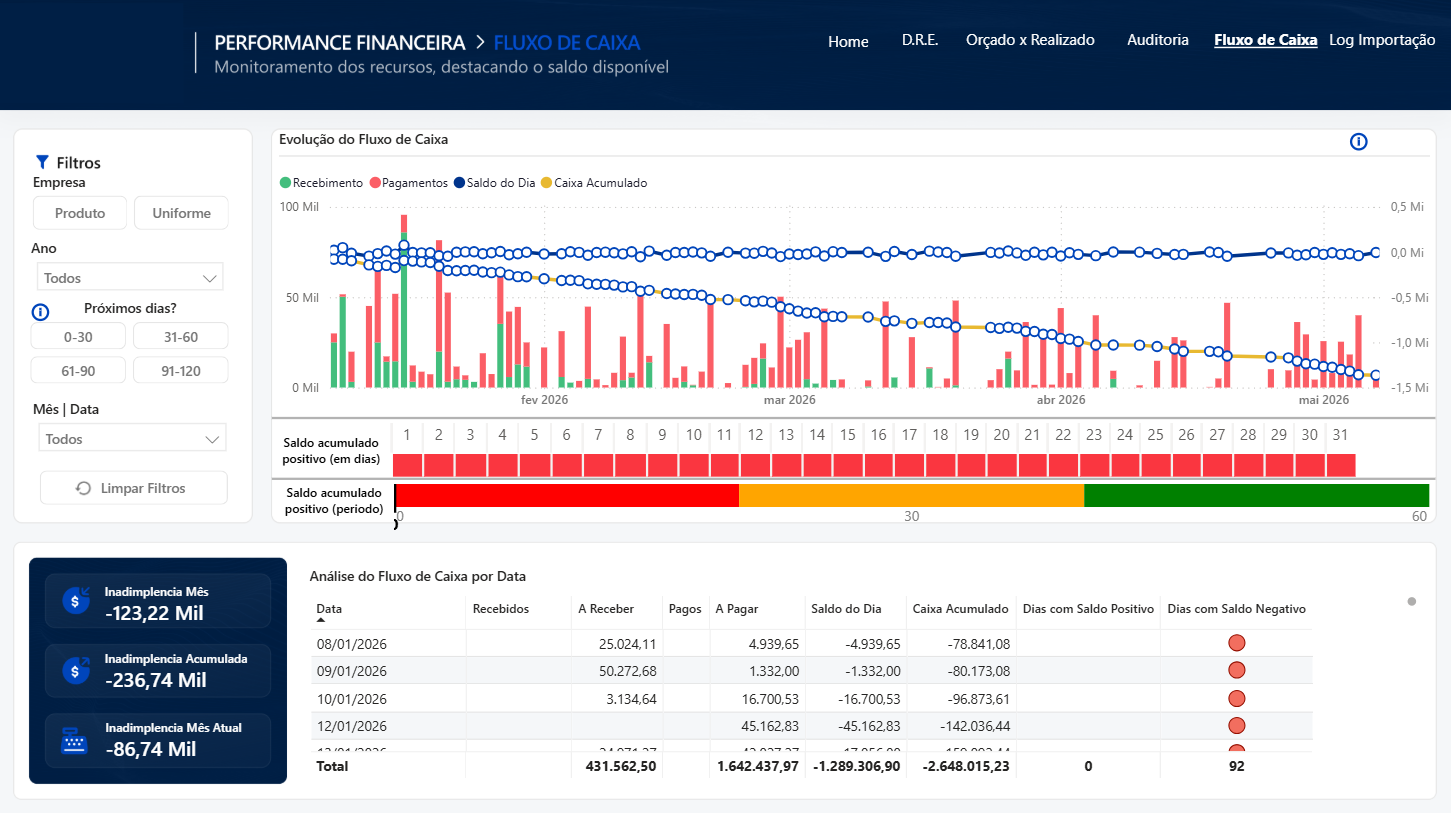
This case demonstrates how technology, when well applied, transforms financial management. The DRE ceases to be a closing report and becomes a strategic, visual and auditable tool.
Companies that adopt this approach gain speed, control and intelligence to decide better.
The question that remains is simple and straightforward:
Does your company see the numbers or just register them?
If you want to leave the operation, gain financial clarity and make decisions safely, DriveData can help.
We developed custom financial dashboards, integrating DRE, Cash Flow, Budget and strategic indicators in Power BI.
Talk to DriveData and find out how to turn your data into a competitive advantage.
Contact us and take your financial management to the next level.
In many transportation operations, a delay only becomes visible after it has already happened.
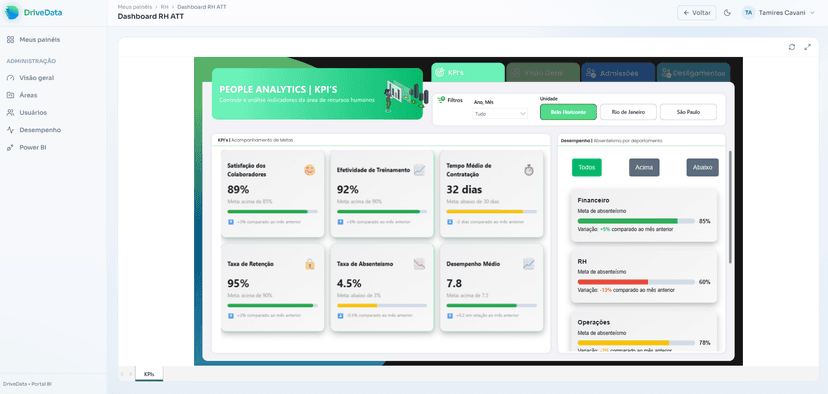
From per-user licensing to shared capacity: the (real case with fictional data) case of a retailer that stopped having to choose between "saving money" and "giving everyone access."
What changes for Power BI and Microsoft Fabric professionals now that the platform is starting to host action — not just analysis.
Tamires · DriveData
online now