Logística Inteligente
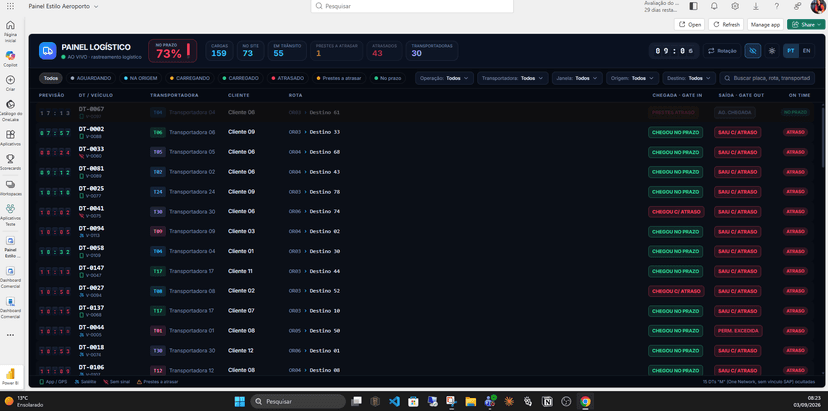
Your shipment is going to be late. The question is: how early will your operation be able to detect it?
In many transportation operations, a delay only becomes visible after it has already happened.

Transformation of Stock Management through ABC Analysis Smart Efficient stock management represents one of the biggest operational challenges for companies of all sizes, especially when it comes to optimizing investments that often exceed tens of millions of real in inventory
Efficient stock management represents one of the biggest operational challenges for companies of all sizes, especially when it comes to optimizing investments that often exceed tens of millions of reals in inventory. The traditional ABC Curve methodology, although conceptually sound, has been limited by static analysis tools and two-dimensional visualizations that do not offer the depth needed to make strategic decisions in real time. DriveData has developed a solution that combines the robustness of ABC analysis with Business Three-dimensional intelligence and visualization, completely transforming the way organizations manage their stocks and optimize their inventory investments.
Our Stock Management Platform Smart goes far beyond simply classifying products into categories A, B and C. It offers an immersive analytical experience that integrates financial metrics, operational indicators and real-time spatial visualization, allowing managers to understand not only which products are most important, but also where they are physically located and how their spatial distribution impacts operational efficiency. This holistic approach results in optimizations that often generate 30% reductions in operating costs and 40% improvements in separation productivity.
The integration between traditional ABC analysis and 3D visualization technologies creates a dimension of understanding about inventory management that transcends limitations of conventional reports.
The ABC analysis, based on the Pareto Principle, establishes that approximately 80% of the stock value is concentrated on 20% of the items, creating a natural classification where Class products A represent high turnover and value, Class B products of intermediate importance, and Class C items of lower financial impact. This methodology, although essential for inventory management, has traditionally been implemented through static spreadsheets and periodic reports that do not offer real-time visibility on changes in classification or impact of operational decisions on overall stock performance.
The limitations of the traditional approach are particularly evident in the inability to correlate ABC classification with physical positioning in the warehouse, resulting in suboptimal layouts where high turnover products can be located in areas of difficult access, while low movement items occupy privileged positions. This disconnect between strategic importance and physical accessibility generates operational inefficiencies that accumulate over time, impacting productivity, operational costs and customer satisfaction.
The lack of integration between ABC analysis and operating systems also limits the ability to monitor real-time change impact. When managers implement layout reorganizations or stock policy adjustments, the effects on ABC classification and operational performance are often only perceived weeks or months later when periodic reports are generated. This time lag prevents continuous optimization and can result in perpetuation of inefficiencies that could be quickly corrected with adequate visibility.
The implementation of Business Intelligence in ABC analysis fundamentally transforms inventory management capacity through three main dimensions: real-time visibility, operational integration and predictive analysis. Our solution offers dashboards that feature rating ABC continuously updated, allowing managers to identify changes in the relative importance of products before they significantly impact operational performance. This early detection capacity is particularly valuable in dynamic markets where demand and value of products can float rapidly.
Operational integration allows automatic correlation between ABC classification and operational metrics such as separation time, distance traveled and productivity per warehouse area. The system can automatically identify when Class products A are generating higher than expected separation times due to inadequate positioning, suggesting specific reorganizations that optimize efficiency without compromising other operations. This multidimensional analysis capability eliminates the need for complex manual analysis and accelerates implementation of improvements.
Predictive analysis adds a temporal dimension to ABC management, allowing for anticipation of changes in classification based on demand trends, seasonality and external factors. The system may provide when Class products C can migrate to Class B due to seasonal changes, allowing proactive adjustments in positioning and stock policies. This predictive capacity transforms stock management from reactive to strategic, allowing organizations to position themselves appropriately for future changes rather than simply react to them.
The reorganisation based on insights of the ABC analysis resulted in strategic redistribution that maintained the same level of capacity utilisation (89%) but significantly optimized accessibility of critical products. Class Products A were repositioned to occupy 60% of the easy-to-reach positions, Class B products were allocated in intermediate positions, and Class products C were moved to areas of less accessibility. This reorganization resulted in a 35% reduction in the average time of separation and a 25% increase in the overall productivity of the operation.
The ability to monitor real-time reorganization impact through integrated dashboards allowed fine adjustments that maximized the benefits of the new configuration. The system identified that certain zones still had opportunities for optimization, suggesting smaller adjustments that resulted in additional improvements of 10% in efficiency. This real-time feedback-based continuous optimization capability ensures that ABC analytics benefits are maximized and maintained over time.
The implementation of Business-based ABC analysis Intelligence transforms working capital management through granular visibility on investment return by product category. The ability to correlate invested value with turnover and margin allows identification of optimization opportunities that often go unnoticed in traditional analyses. Class A products, which represent most of the invested value, can be analyzed individually to identify items with performance below the potential that would justify specific commercial strategies or adjustments in stock policies.
Analysis of Class Products C reveals significant opportunities to release working capital through stock reduction strategies that do not significantly impact the availability of critical products. The system can identify Class products C with extremely low turnover that are immobilizing capital unnecessarily, suggesting settlement or discontinuation strategies that release resources for investment in products of higher strategic value. This product mix optimization often results in 20% to 30% improvements in working capital efficiency.
The ability to monitor changes in stock policies on real-time ABC classification allows dynamic management that adapts strategies based on market changes or operational performance. When products migrate between classes due to demand changes or commercial strategies, the system automatically suggests adjustments in inventory policies, physical positioning and allocation of resources that maintain optimization aligned with new reality. This adaptability ensures that the benefits of ABC analysis are maintained even in dynamic business environments.
Implementation of Business-based ABC Curve Intelligence creates continuous improvement capacity that automatically evolves based on changes in demand behavior, commercial strategies and market conditions. The system continuously monitors product performance and suggests reclassifications when turnover or value patterns justify changes in ABC categorization. This adaptability ensures that classification remains relevant and useful for decision making, rather than becoming static and outdated as often happens with traditional implementations.
The predictive analysis capacity allows for anticipation of changes in the ABC classification based on emerging trends, seasonality and external factors. The system may provide when Class products C can migrate to higher classes due to seasonal changes or marketing strategies, allowing proactive adjustments in positioning and stock policies that capitalize opportunities before they manifest themselves completely. This predictive capacity transforms stock management from reactive to strategic.
Integration with demand planning and commercial management systems creates analytical ecosystem that optimizes not only inventory management, but also shopping, marketing and sales strategies based on insights from ABC analysis. Products identified as having the potential for migration to higher classes can receive additional investment in marketing, while products in decline can be managed through settlement strategies that maximize value recovery. This systemic integration maximizes ABC analysis value for the entire organization.
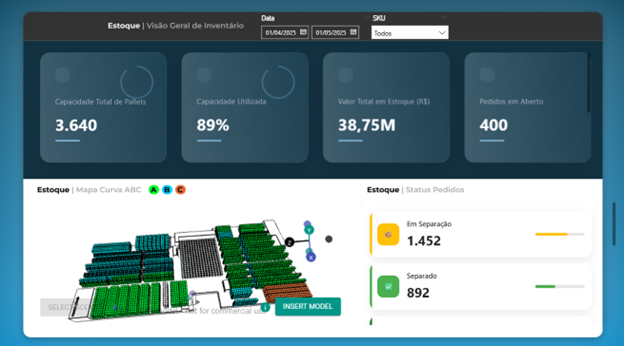
Learn more about our ABC and Business Curve solutions Intelligence for stock management, and find out how we can turn your inventory into a sustainable competitive advantage. DriveData is ready to be your partner in the transformation journey that will take your stock management to the next level of intelligence and operational efficiency.
In many transportation operations, a delay only becomes visible after it has already happened.
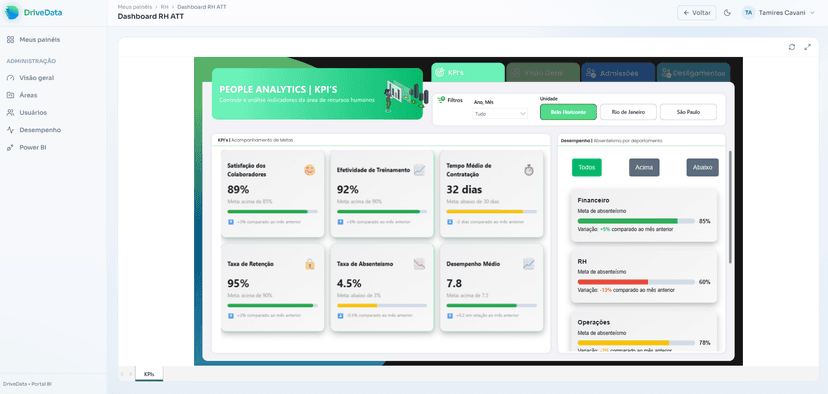
From per-user licensing to shared capacity: the (real case with fictional data) case of a retailer that stopped having to choose between "saving money" and "giving everyone access."
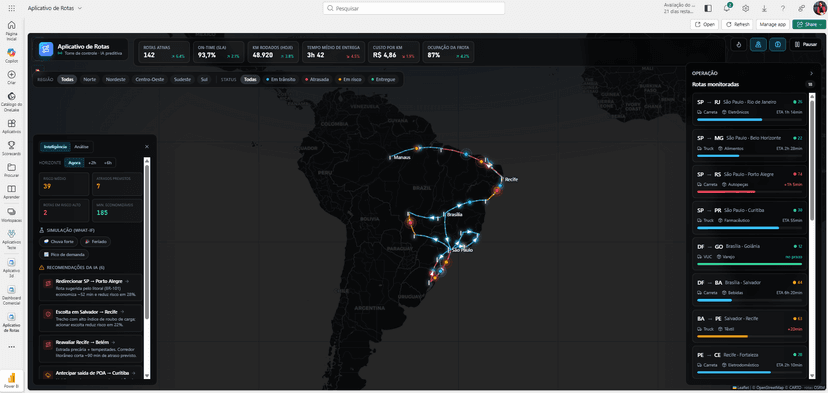
What changes for Power BI and Microsoft Fabric professionals now that the platform is starting to host action — not just analysis.
Tamires · DriveData
online now